

Question: Assuming you have the data DataFrame with the U . S . Economic Policy Uncertainty Index ( EPU ) and the VIX index from FRED,
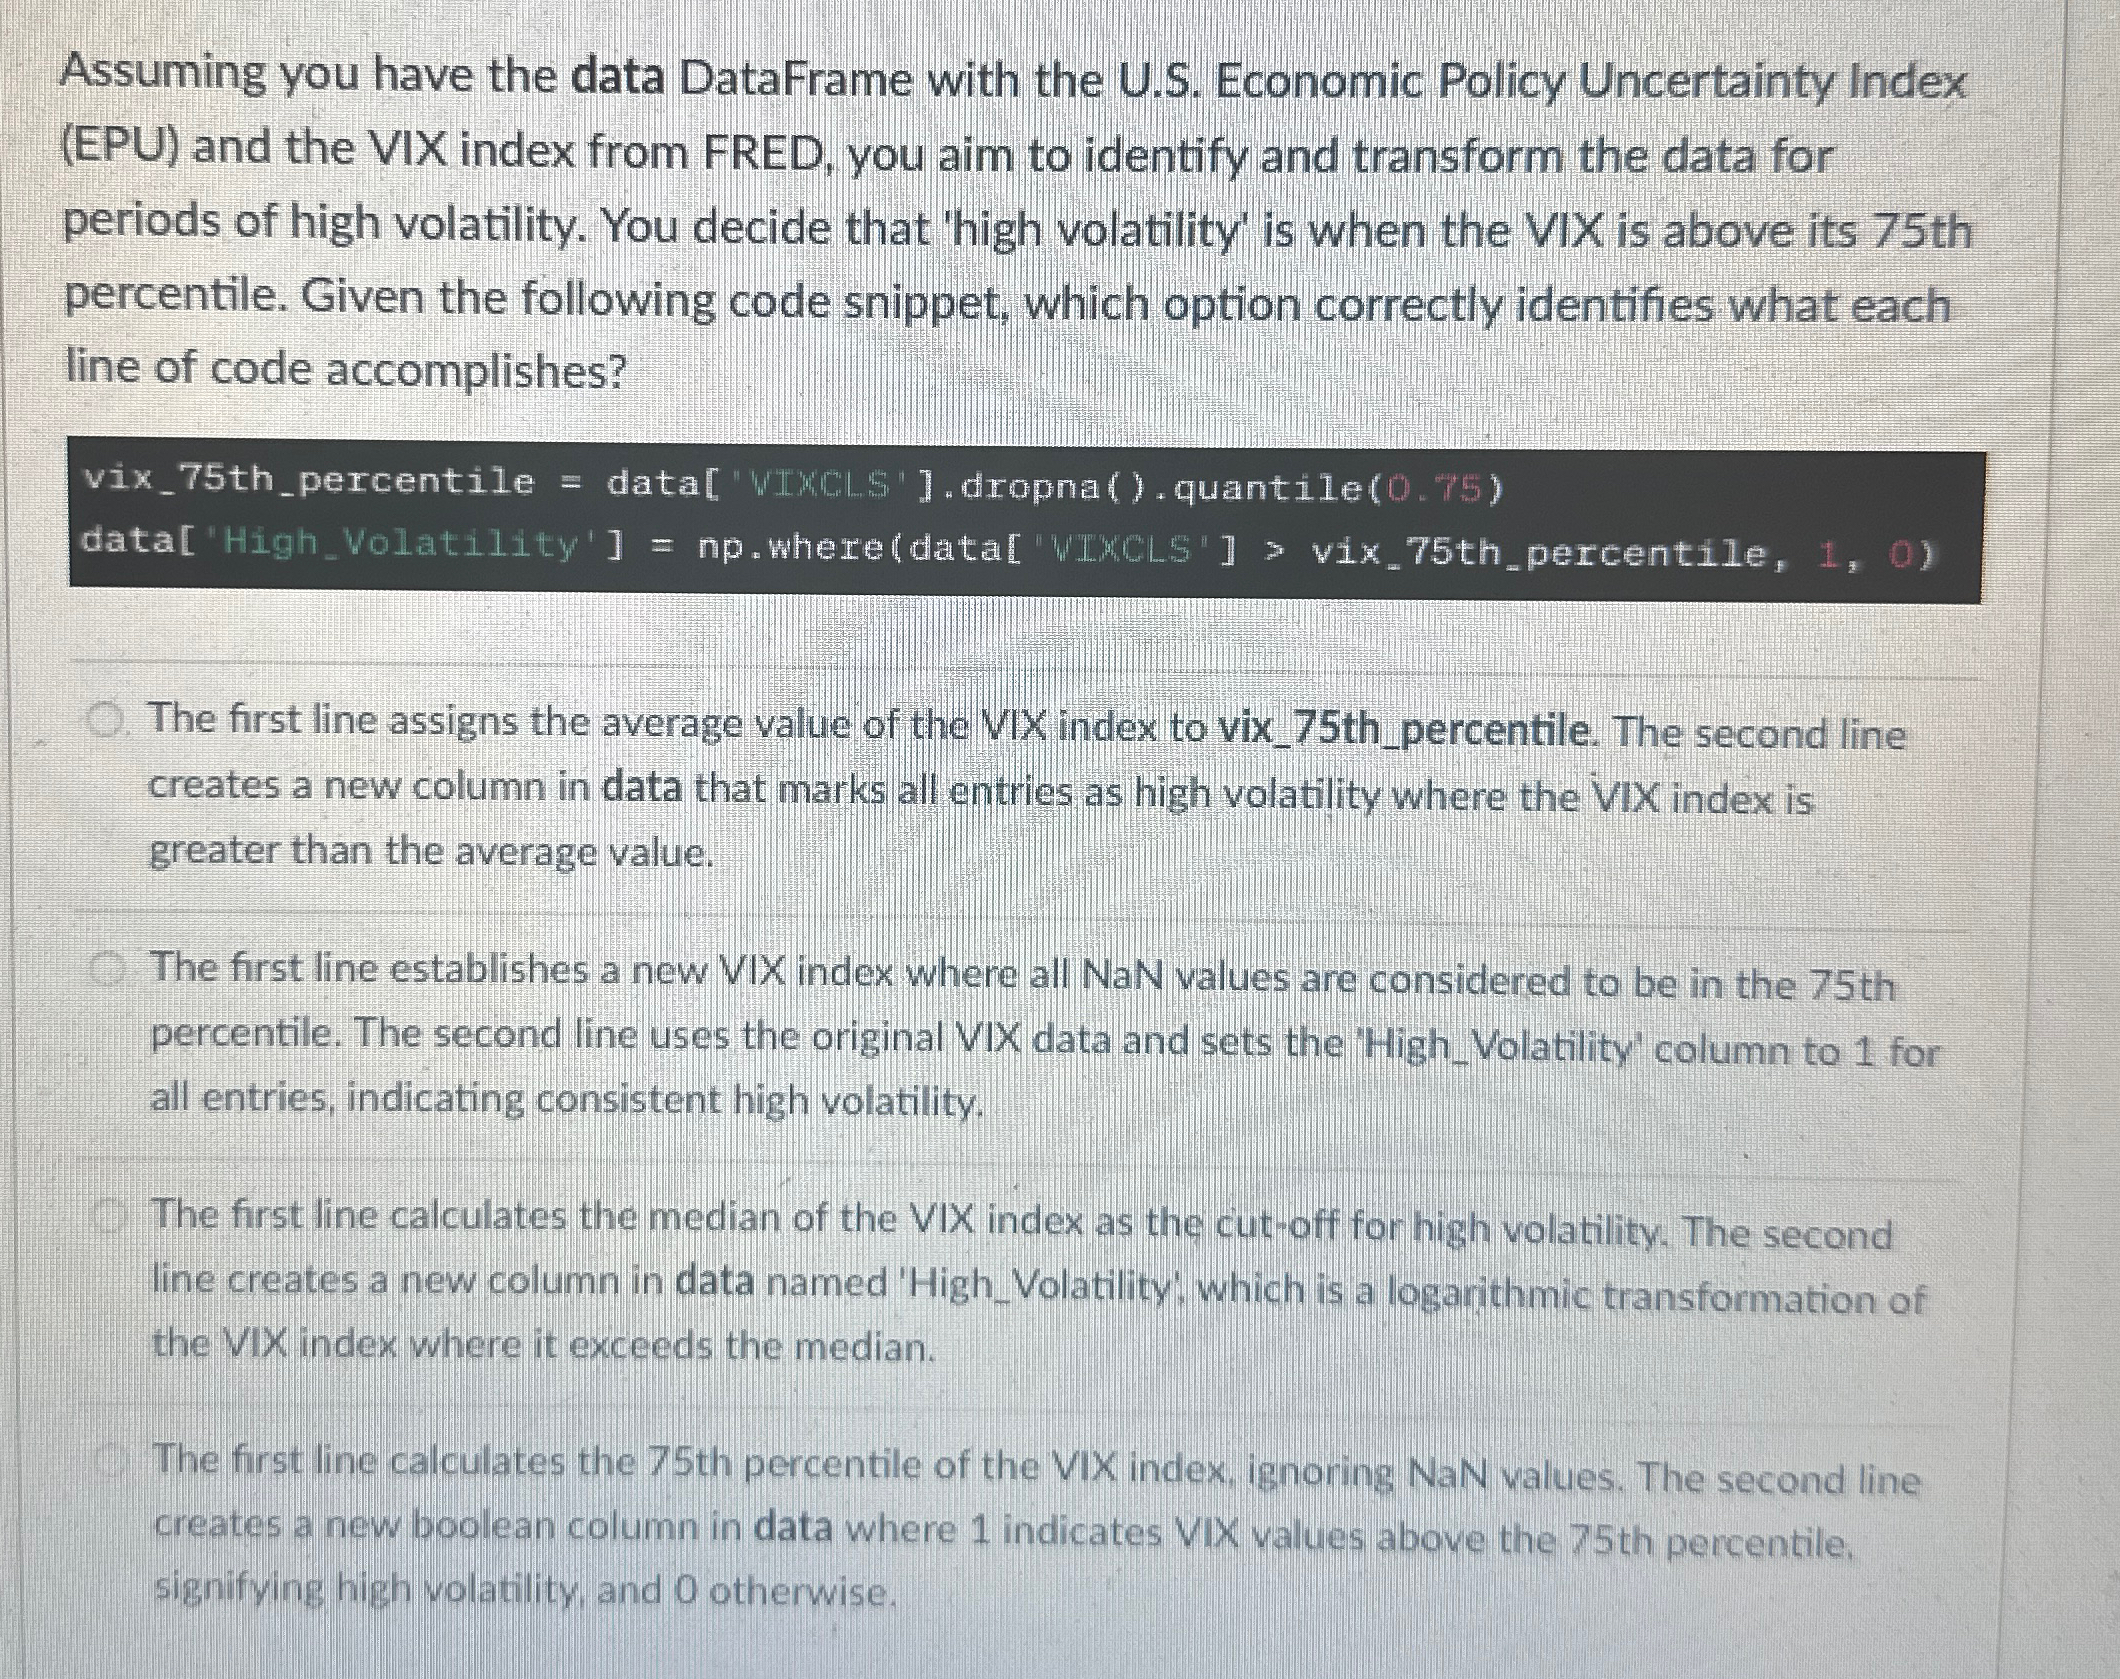
Assuming you have the data DataFrame with the US Economic Policy Uncertainty Index EPU and the VIX index from FRED, you aim to identify and transform the data for periods of high volatility. You decide that 'high volatility' is when the VIX is above its th percentile. Given the following code snippet, which option correctly identifies what each line of code accomplishes?
vixthpercentile data WIMCLS'dropnaquantile
dataHighVolatility' npwheredata WLMCLS vixthpercentile,
The first line assigns the average value of the VIX index to vixthpercentile. The second line creates a new column in data that marks all entries as high volatility where the VIX index is greater than the average value.
The first line establishes a new VIX index where all NaN values are considered to be in the th percentile. The second line uses the original VIX data and sets the 'HighVolatility' column to for all entries, indicating consistent high volatility.
The first line calculates the median of the VIX index as the cutoff for high volatility. The second line creates a new column in data named 'HighVolatility', which is a logarithmic transformation of the VIX index where it exceeds the median.
The first line calculates the th percentile of the VIX index, ignoring NaN values. The second line creates a new boolean column in data where indicates VIX values above the th percentile, signifying high volatility, and otherwise.
Step by Step Solution
There are 3 Steps involved in it
1 Expert Approved Answer
Step: 1 Unlock

Question Has Been Solved by an Expert!
Get step-by-step solutions from verified subject matter experts
Step: 2 Unlock
Step: 3 Unlock