

Question: At first, it seems as though measuring how much variation there is in a data set would be easy-all one would do is subtract each
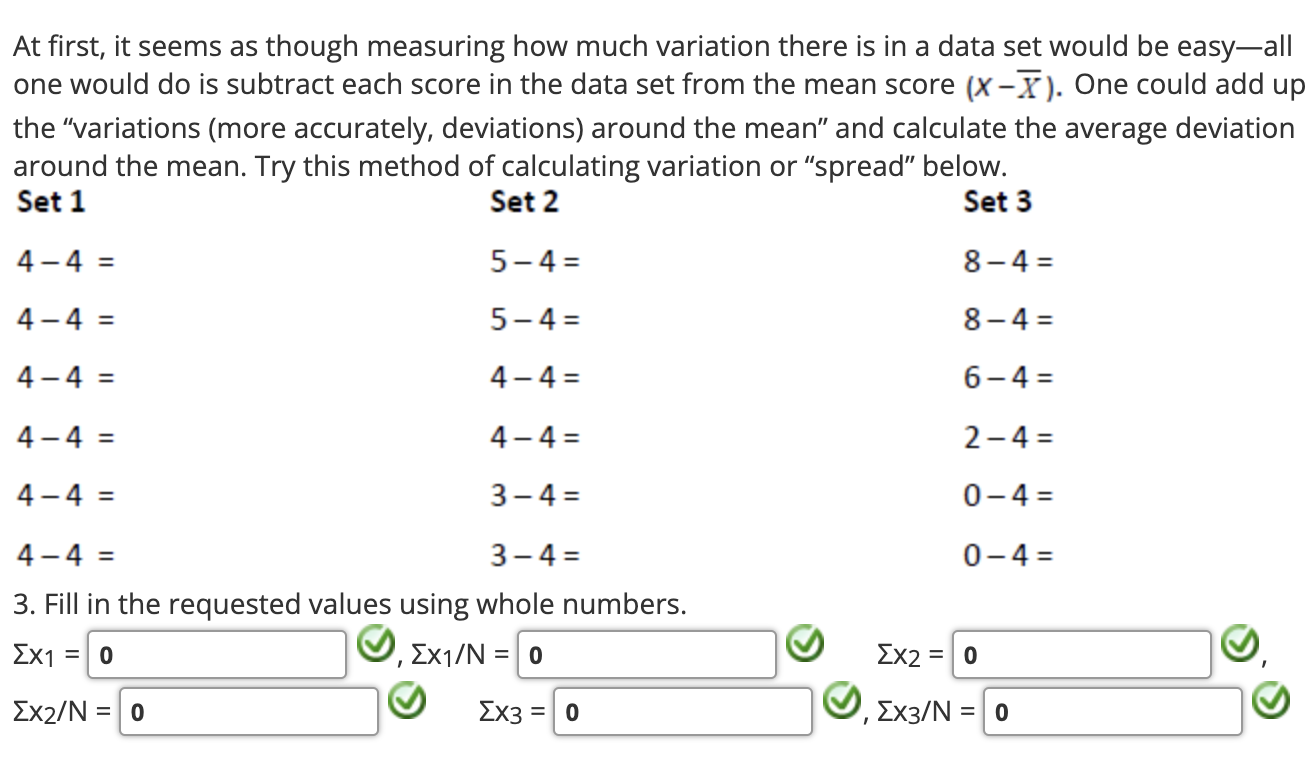
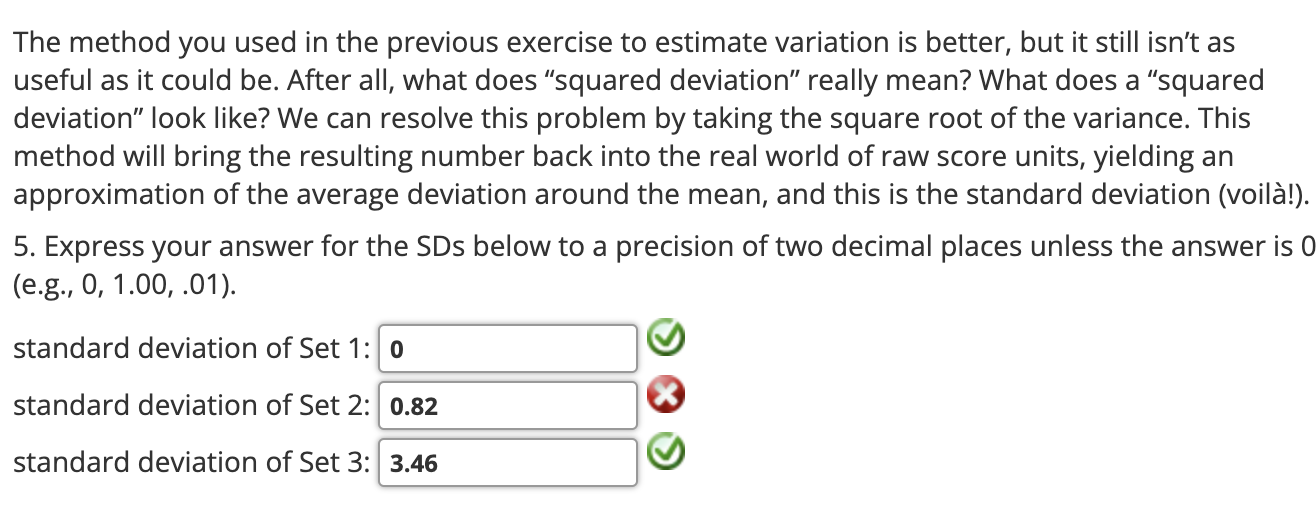
At first, it seems as though measuring how much variation there is in a data set would be easy-all one would do is subtract each score in the data set from the mean score (X-X). One could add up the "variations (more accurately, deviations) around the mean" and calculate the average deviation around the mean. Try this method of calculating variation or "spread" below. Set 1 Set 2 Set 3 4-4 = 5-4= 8-4= 4-4 = 5-4= 8-4= 4-4 = 4-4= 6-4= 4-4 = 4-4= 2-4= 4-4 = 3-4= 0-4= 4-4 = 3-4= 0-4= 3. Fill in the requested values using whole numbers. EX1= 0 EX1/N = 0 J EX2 : 0 EX2/N = 0 EX3 = 0 EX3/N = 0The method you used in the previous exercise to estimate variation is better, but it still isn't as useful as it could be. After all, what does "squared deviation\" really mean? What does a \"squared deviation" look like? We can resolve this problem by taking the square root of the variance. This method will bring the resulting number back into the real world of raw score units, yielding an approximation of the average deviation around the mean, and this is the standard deviation (voilal). 5. Express your answer for the SDs below to a precision of two decimal places unless the answer is 0 (e.g., 0, 1.00, .01). standard deviation of Set 1: C] 9 standard deviation of Set 2: 0 standard deviation of Set 3: 9
Step by Step Solution
There are 3 Steps involved in it

Get step-by-step solutions from verified subject matter experts