

Question: at least a and c please 1. The plot on the next page shows the speed distribution for N2(g) according to kinetic theory. a) Determine
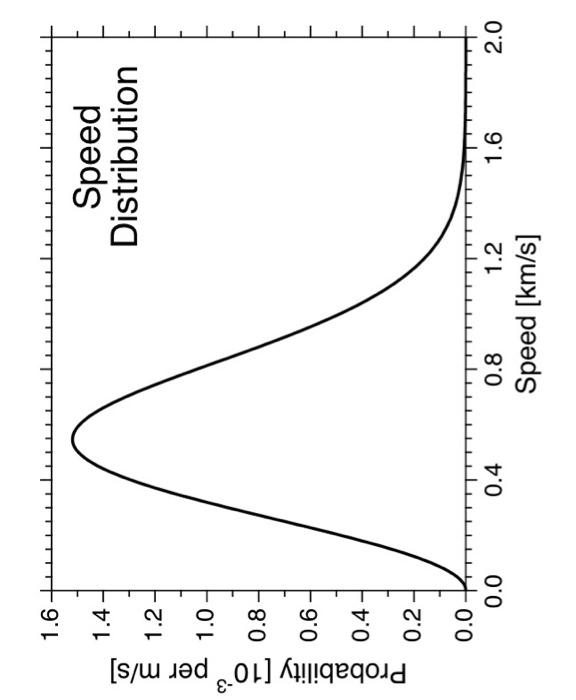
1. The plot on the next page shows the speed distribution for N2(g) according to kinetic theory. a) Determine the most probable speed in km/s and the probability at that speed directly from the graph, both with high precision. Proof of your hand calculations taken from the graph is required for full credit on this part. (15) b) Calculate the mean speed and root mean square speed using the most probable speed that you measured from the graph. (10) c) Determine the gas temperature in C with high precision. (15) d) Calculate the value for probability at the most probable speed using the most probable speed and gas temperature that you obtained above. Prove that you calculation agrees with the value that you determined from the graph
Step by Step Solution
There are 3 Steps involved in it

Get step-by-step solutions from verified subject matter experts