

Question: At sample size = 4, B3 = 0 and B4 = 2.266. USL = B4*s-bar = 2.266*0.584 = 1.323 LSL = B3*s-bar = 0*0.584 =
At sample size = 4, B3 = 0 and B4 = 2.266.
USL = B4*s-bar = 2.266*0.584 = 1.323
LSL = B3*s-bar = 0*0.584 = 0
FIND
Using the scenario and data above determine the capability of the process. Calculate both Cp and Cpk. Based among these, state if the process is capable and your reason for concluding this? Assume that the histogram of the individual measurements is approximately bell-shaped. Estimate the percentage of items that will:
1. Meet the specifications
2. Exceed the upper specification limit
3. Fall below the lower specification limit
Round all calculations to three (3) decimal places.
PLEASE HELP I WILL GIVE 5 STARS AND THUMBS UP
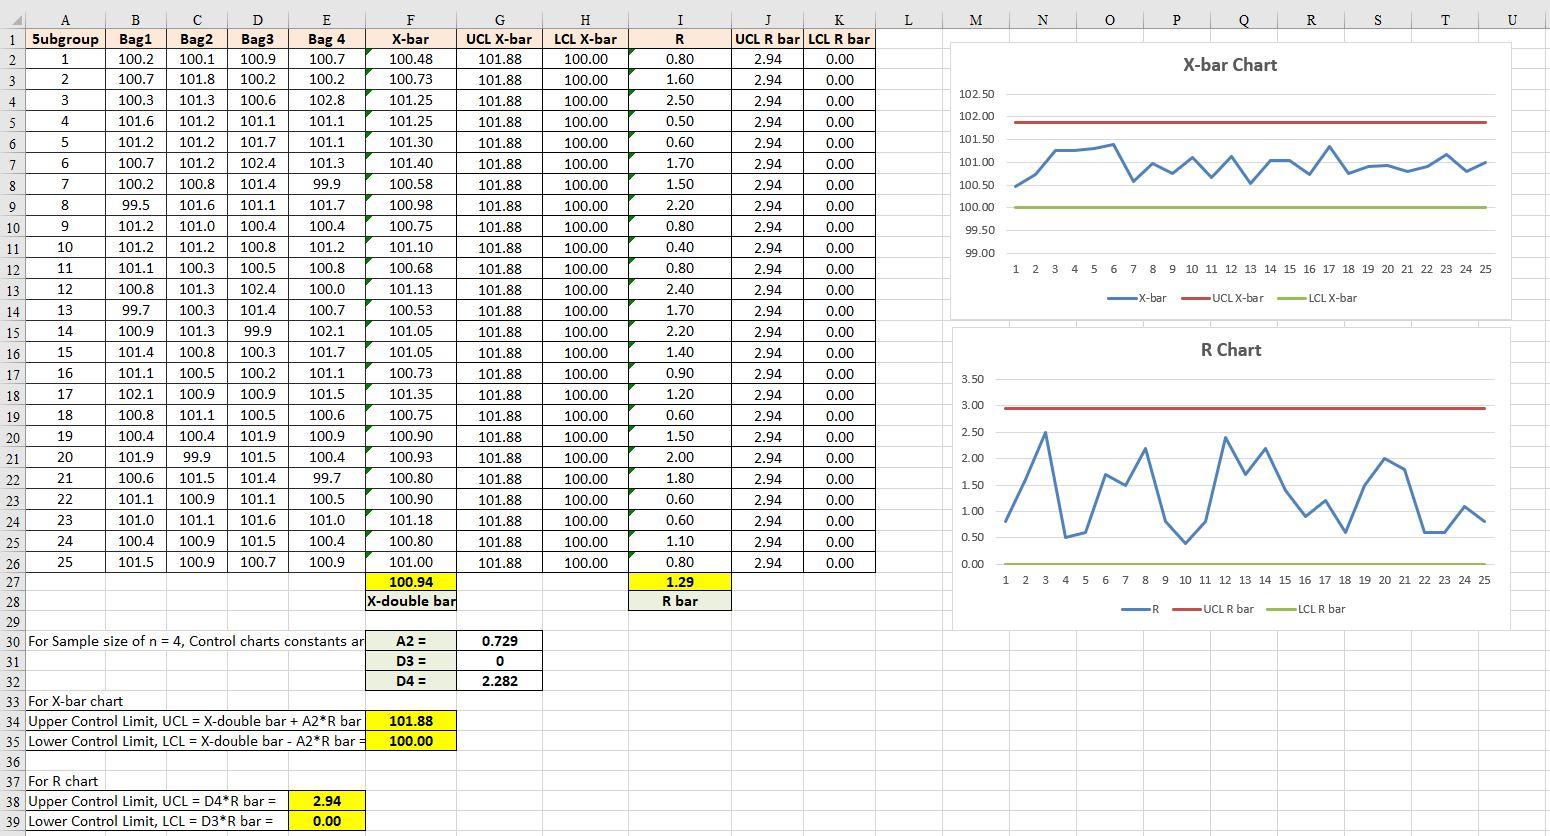
I L M N O P Q R S T U R 0.80 1.60 X-bar Chart 102.50 102.00 101.50 101.00 100.50 100.00 99.50 2.50 0.50 0.60 1.70 1.50 2.20 0.80 0.40 0.80 2.40 1.70 2.20 1.40 0.90 1.20 0.60 99.00 G UCL X-bar 101.88 101.88 101.88 101.88 101.88 101.88 101.88 101.88 101.88 101.88 101.88 101.88 101.88 101.88 101.88 101.88 101.88 101.88 101.88 101.88 101.88 101.88 101.88 101.88 101.88 1 1 2 3 4 5 6 7 8 9 10 11 12 13 14 15 16 17 18 19 20 21 22 23 24 25 H LCL X-bar 100.00 100.00 100.00 100.00 100.00 100.00 100.00 100.00 100.00 100.00 100.00 100.00 100.00 100.00 100.00 100.00 100.00 100.00 100.00 100.00 100.00 100.00 100.00 100.00 100.00 J K UCL R bar LCL R bar 2.94 0.00 2.94 0.00 2.94 0.00 2.94 0.00 2.94 0.00 2.94 0.00 2.94 0.00 2.94 0.00 2.94 0.00 2.94 0.00 2.94 0.00 2.94 0.00 2.94 0.00 2.94 0.00 2.94 0.00 2.94 0.00 2.94 0.00 2.94 0.00 2.94 0.00 2.94 0.00 2.94 0.00 -X-bar UCL X-bar -LCL X-bar A B C D E F 1 Subgroup Bag1 Bag2 Bag3 Bag 4 X-bar 2 1 100.2 100.1 100.9 100.7 100.48 3 2 100.7 101.8 100.2 100.2 100.73 4 3 100.3 101.3 100.6 102.8 101.25 5 4 101.6 101.2 101.1 101.1 101.25 6 5 101.2 101.2 101.7 101.1 101.30 7 6 100.7 101.2 102.4 101.3 101.40 8 7 100.2 100.8 101.4 99.9 100.58 9 8 99.5 101.6 101.1 101.7 100.98 10 9 101.2 101.0 100.4 100.4 100.75 11 10 101.2 101.2 100.8 101.2 101.10 12 11 101.1 100.3 100.5 100.8 100.68 13 12 100.8 101.3 102.4 100.0 101.13 14 13 99.7 100.3 101.4 100.7 100.53 15 14 100.9 101.3 99.9 102.1 101.05 16 15 101.4 100.8 100.3 101.7 101.05 17 16 101.1 100.5 100.2 101.1 100.73 18 17 102.1 100.9 100.9 101.5 101.35 19 18 100.8 101.1 100.5 100.6 100.75 20 19 100.4 100.4 101.9 100.9 100.90 21 20 101.9 99.9 101.5 100.4 100.93 22 21 100.6 101.5 101.4 99.7 100.80 23 22 101.1 100.9 101.1 100.5 100.90 24 23 101.0 101.1 101.6 101.0 101.18 25 24 100.4 100.9 101.5 100.4 100.80 26 25 101.5 100.9 100.7 100.9 101.00 27 100.94 28 X-double bar 29 30 For Sample size of n = 4, Control charts constants ar A2 = 31 D3 = 32 D4 = 33 For X-bar chart 34 Upper Control Limit, UCL = X-double bar + A2*R bar 101.88 35 Lower Control Limit, LCL = X-double bar - A2*R bar = 100.00 36 37 For R chart 38 Upper Control Limit, UCL = D4*R bar = 2.94 39 Lower Control Limit, LCL = D3*R bar = 0.00 R Chart 3.50 3.00 2.50 2.00 um 1.50 2.94 0.00 1.50 2.00 1.80 0.60 0.60 1.10 0.80 1.29 R bar 1.00 2.94 2.94 2.94 0.00 0.00 0.00 0.50 0.00 1 2 3 4 5 6 7 8 9 10 11 12 13 14 15 16 17 18 19 20 21 22 23 24 25 R UCL R bar LCL R bar 0.729 0 2.282 I L M N O P Q R S T U R 0.80 1.60 X-bar Chart 102.50 102.00 101.50 101.00 100.50 100.00 99.50 2.50 0.50 0.60 1.70 1.50 2.20 0.80 0.40 0.80 2.40 1.70 2.20 1.40 0.90 1.20 0.60 99.00 G UCL X-bar 101.88 101.88 101.88 101.88 101.88 101.88 101.88 101.88 101.88 101.88 101.88 101.88 101.88 101.88 101.88 101.88 101.88 101.88 101.88 101.88 101.88 101.88 101.88 101.88 101.88 1 1 2 3 4 5 6 7 8 9 10 11 12 13 14 15 16 17 18 19 20 21 22 23 24 25 H LCL X-bar 100.00 100.00 100.00 100.00 100.00 100.00 100.00 100.00 100.00 100.00 100.00 100.00 100.00 100.00 100.00 100.00 100.00 100.00 100.00 100.00 100.00 100.00 100.00 100.00 100.00 J K UCL R bar LCL R bar 2.94 0.00 2.94 0.00 2.94 0.00 2.94 0.00 2.94 0.00 2.94 0.00 2.94 0.00 2.94 0.00 2.94 0.00 2.94 0.00 2.94 0.00 2.94 0.00 2.94 0.00 2.94 0.00 2.94 0.00 2.94 0.00 2.94 0.00 2.94 0.00 2.94 0.00 2.94 0.00 2.94 0.00 -X-bar UCL X-bar -LCL X-bar A B C D E F 1 Subgroup Bag1 Bag2 Bag3 Bag 4 X-bar 2 1 100.2 100.1 100.9 100.7 100.48 3 2 100.7 101.8 100.2 100.2 100.73 4 3 100.3 101.3 100.6 102.8 101.25 5 4 101.6 101.2 101.1 101.1 101.25 6 5 101.2 101.2 101.7 101.1 101.30 7 6 100.7 101.2 102.4 101.3 101.40 8 7 100.2 100.8 101.4 99.9 100.58 9 8 99.5 101.6 101.1 101.7 100.98 10 9 101.2 101.0 100.4 100.4 100.75 11 10 101.2 101.2 100.8 101.2 101.10 12 11 101.1 100.3 100.5 100.8 100.68 13 12 100.8 101.3 102.4 100.0 101.13 14 13 99.7 100.3 101.4 100.7 100.53 15 14 100.9 101.3 99.9 102.1 101.05 16 15 101.4 100.8 100.3 101.7 101.05 17 16 101.1 100.5 100.2 101.1 100.73 18 17 102.1 100.9 100.9 101.5 101.35 19 18 100.8 101.1 100.5 100.6 100.75 20 19 100.4 100.4 101.9 100.9 100.90 21 20 101.9 99.9 101.5 100.4 100.93 22 21 100.6 101.5 101.4 99.7 100.80 23 22 101.1 100.9 101.1 100.5 100.90 24 23 101.0 101.1 101.6 101.0 101.18 25 24 100.4 100.9 101.5 100.4 100.80 26 25 101.5 100.9 100.7 100.9 101.00 27 100.94 28 X-double bar 29 30 For Sample size of n = 4, Control charts constants ar A2 = 31 D3 = 32 D4 = 33 For X-bar chart 34 Upper Control Limit, UCL = X-double bar + A2*R bar 101.88 35 Lower Control Limit, LCL = X-double bar - A2*R bar = 100.00 36 37 For R chart 38 Upper Control Limit, UCL = D4*R bar = 2.94 39 Lower Control Limit, LCL = D3*R bar = 0.00 R Chart 3.50 3.00 2.50 2.00 um 1.50 2.94 0.00 1.50 2.00 1.80 0.60 0.60 1.10 0.80 1.29 R bar 1.00 2.94 2.94 2.94 0.00 0.00 0.00 0.50 0.00 1 2 3 4 5 6 7 8 9 10 11 12 13 14 15 16 17 18 19 20 21 22 23 24 25 R UCL R bar LCL R bar 0.729 0 2.282Step by Step Solution
There are 3 Steps involved in it
1 Expert Approved Answer
Step: 1 Unlock

Question Has Been Solved by an Expert!
Get step-by-step solutions from verified subject matter experts
Step: 2 Unlock
Step: 3 Unlock