

Question: a.The chart also shows that for the 12 months ending in May 2020, the all items index essentially didn't change (it was close to zero)
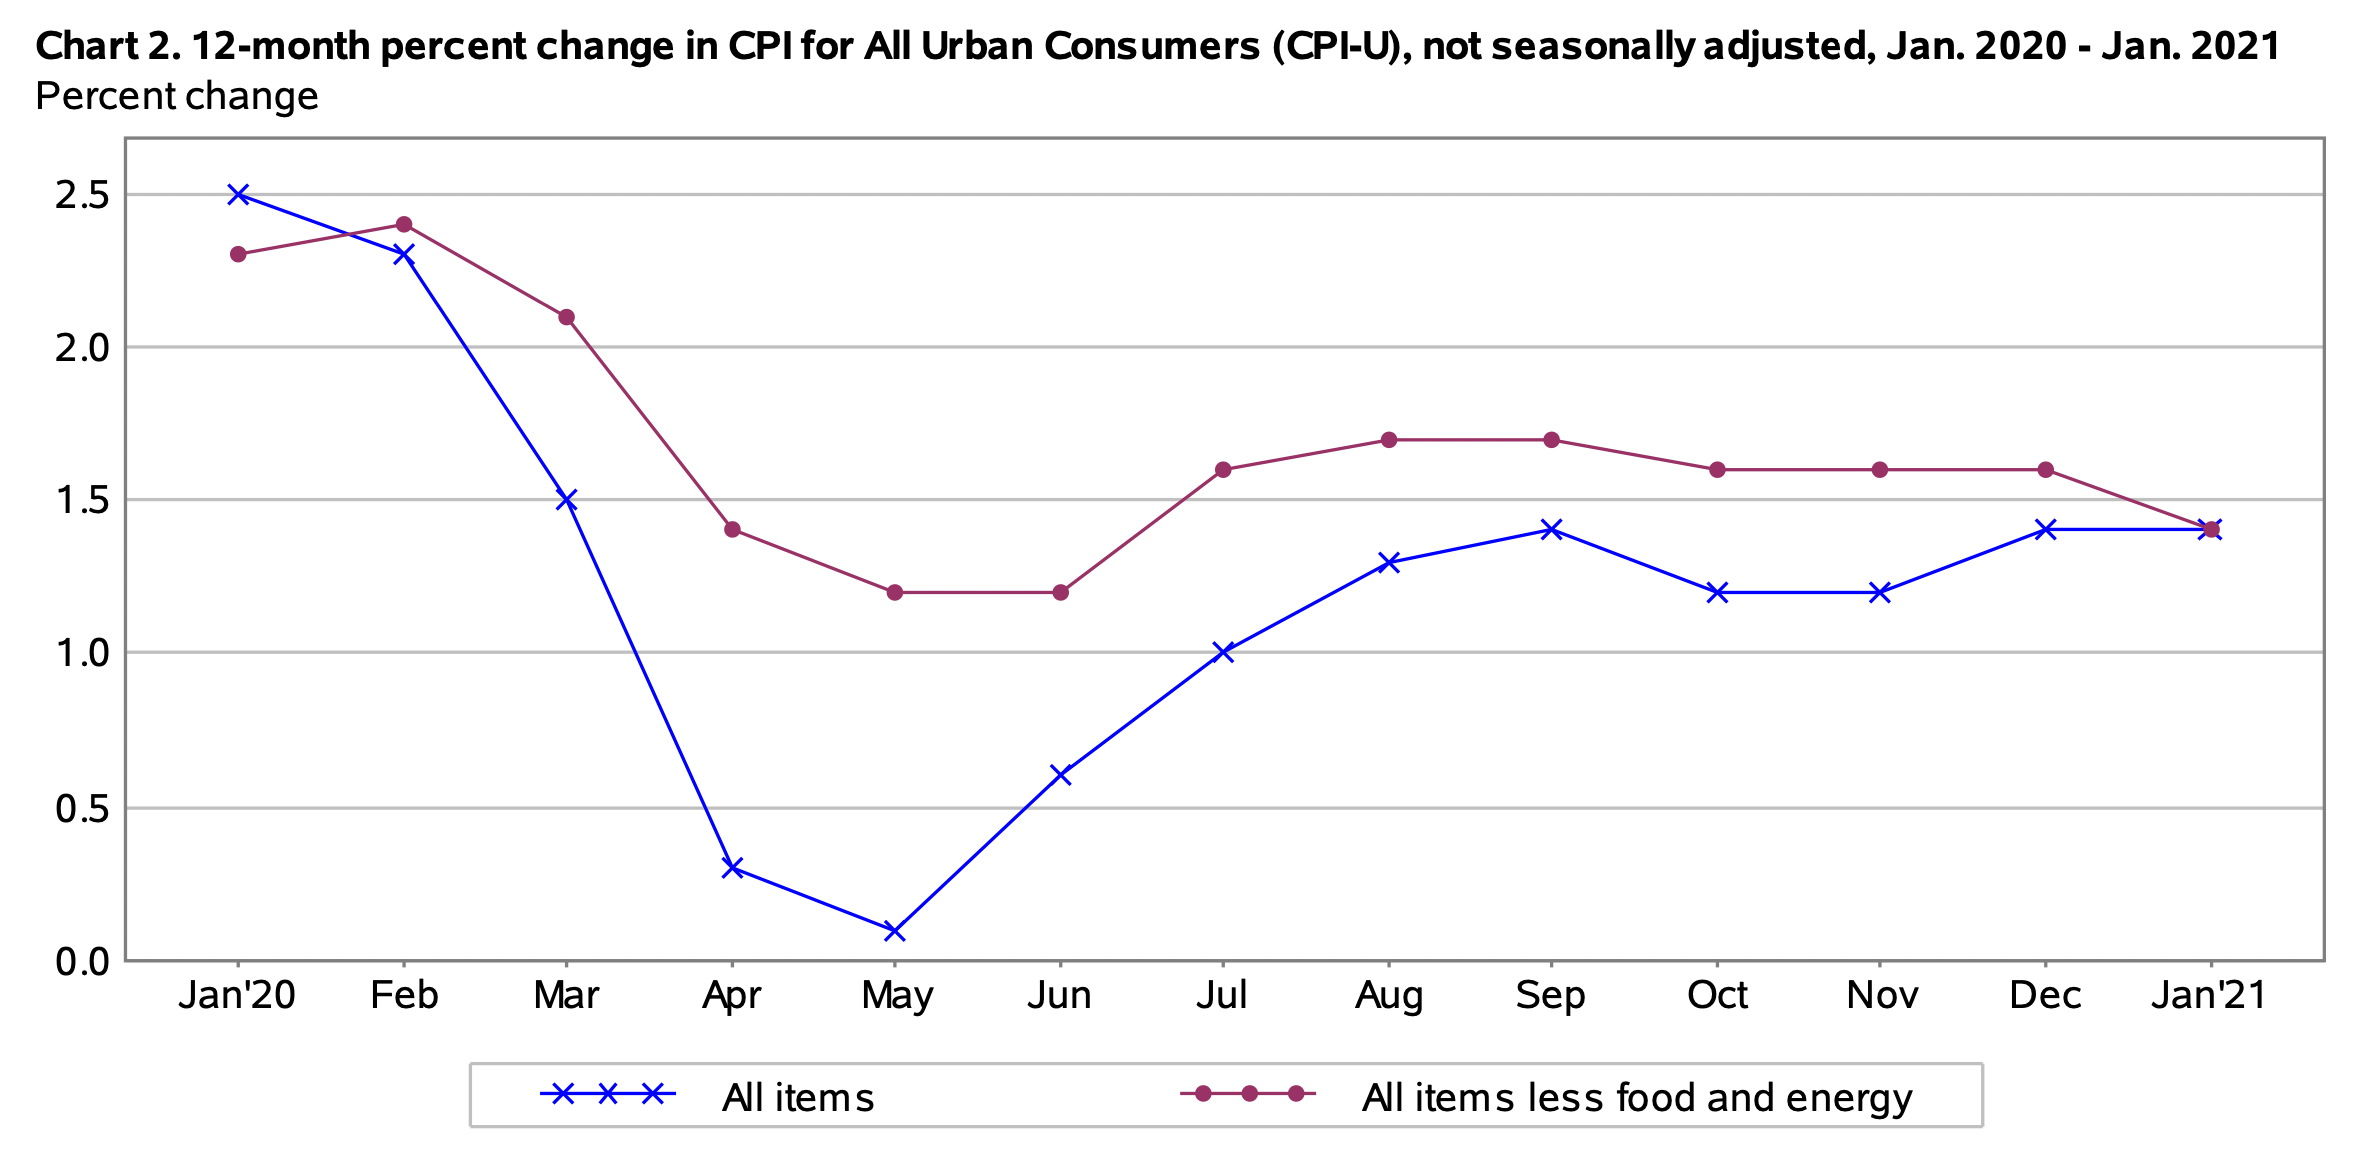
a.The chart also shows that for the 12 months ending in May 2020, the all items index essentially didn't change (it was close to zero) while the index for all items less food and energy rose more than 1 percent. What do these two facts tell us about the average change, if any, in food and energy prices over those 12 months? Specifically, did food and energy prices change, and if so, in which direction? Explain. [1 line]

Chart 2. 12-month percent change in CPI for All Urban Consumers (CPI-U), not seasonally adjusted, Jan. 2020 - Jan. 2021 Percent change 2.5 2.0 1.5 * X * 1.0 0.5 0.0 Jan'20 Feb Mar Apr May Jun Jul Aug Sep Oct Nov Dec Jan'21 X X X All items All items less food and energy
Step by Step Solution
There are 3 Steps involved in it

Get step-by-step solutions from verified subject matter experts