

Question: a.There is one dot on the graph at65.5.Explain what this dot represents. b.Would it be unusual to get a sample mean of 63.0 or less
a.There is one dot on the graph at65.5.Explain what this dot represents.
b.Would it be unusual to get a sample mean of 63.0 or less in a sample of size 20 when= 64.7 inches.
c.Based on your answer to part (b), is there convincing evidence that the claim is true.
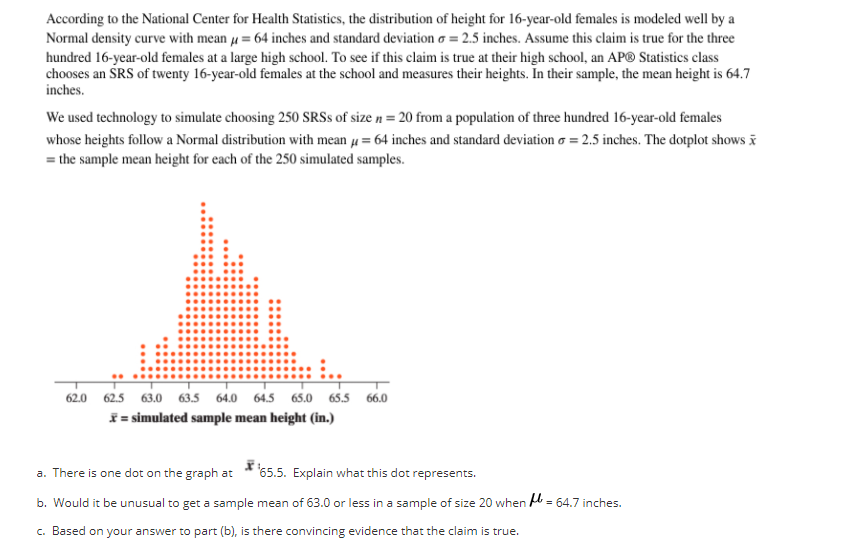
According to the National Center for Health Statistics, the distribution of height for 16-year-old females is modeled well by a Normal density curve with mean # = 64 inches and standard deviation o = 2.5 inches. Assume this claim is true for the three hundred 16-year-old females at a large high school. To see if this claim is true at their high school, an AP@ Statistics class chooses an SRS of twenty 16-year-old females at the school and measures their heights. In their sample, the mean height is 64.7 inches. We used technology to simulate choosing 250 SRSs of size , = 20 from a population of three hundred 16-year-old females whose heights follow a Normal distribution with mean # = 64 inches and standard deviation o = 2.5 inches. The dotplot shows x = the sample mean height for each of the 250 simulated samples. . . ... . .. ..... .... ... ..... ...... ....... .. ... .. 62.0 62.5 63.0 63.5 64.0 64.5 65.0 65.5 66.0 F = simulated sample mean height (in.) a. There is one dot on the graph at *65.5. Explain what this dot represents. b. Would it be unusual to get a sample mean of 63.0 or less in a sample of size 20 when / = 64.7 inches. c. Based on your answer to part (b), is there convincing evidence that the claim is true
Step by Step Solution
There are 3 Steps involved in it

Get step-by-step solutions from verified subject matter experts