

Question: ation Assignment 1 Saved The table below shows hypothetical values of nominal and real GDP for the United States between 2012 and 2016. Real GDP
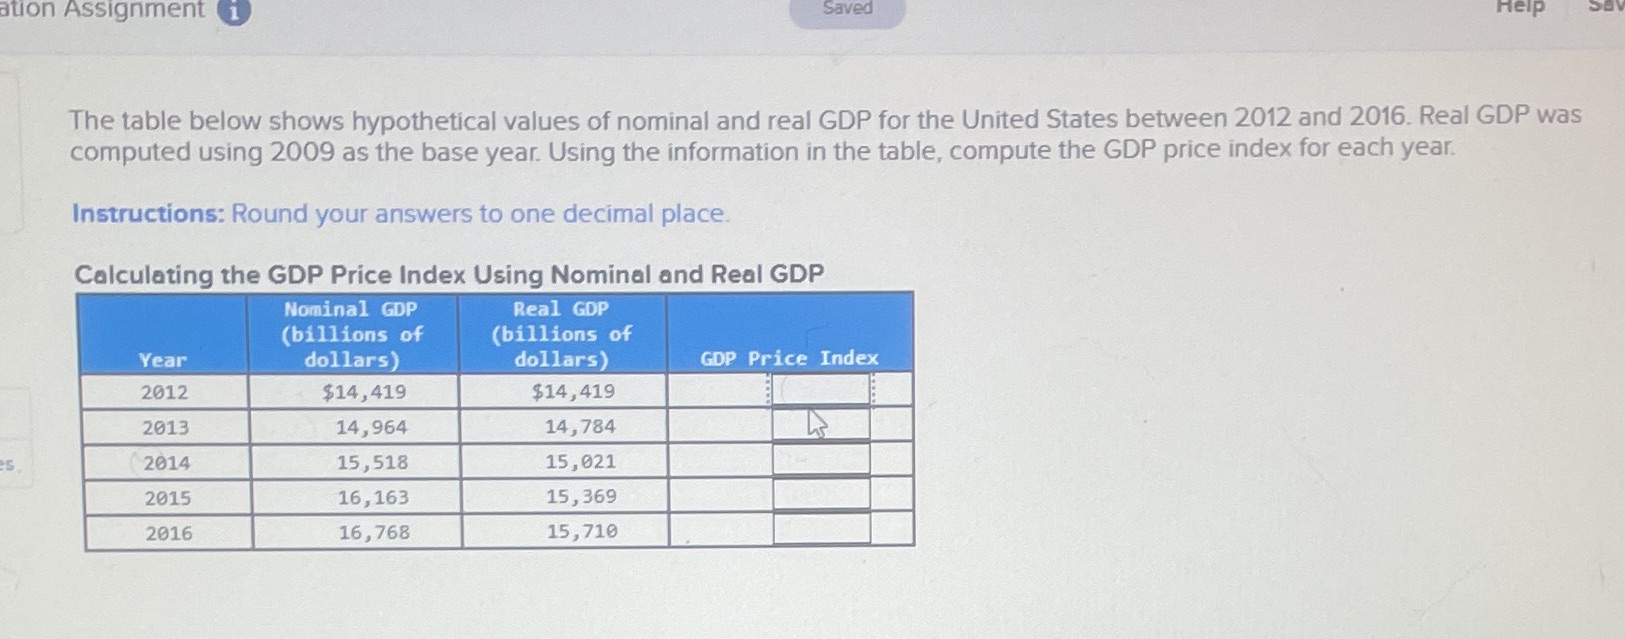
ation Assignment 1 Saved The table below shows hypothetical values of nominal and real GDP for the United States between 2012 and 2016. Real GDP was computed using 2009 as the base year. Using the information in the table, compute the GDP price index for each year. Instructions: Round your answers to one decimal place. Calculating the GDP Price Index Using Nominal and Real GDP Nominal GDP Real GDP (billions of (billions of Year dollars) dollars) GDP Price Index 2012 $14, 419 $14, 419 2013 14,964 14, 784 2014 15 , 518 15, 021 2015 16, 163 15, 369 2016 16, 768 15, 710
Step by Step Solution
There are 3 Steps involved in it
1 Expert Approved Answer
Step: 1 Unlock

Question Has Been Solved by an Expert!
Get step-by-step solutions from verified subject matter experts
Step: 2 Unlock
Step: 3 Unlock