

Question: ation onomics Problem Set 8.3 189 Problem Set 8.3 Benchmarking Inflation The following inflation figures were calculated using the Consumer Price Index for All Items
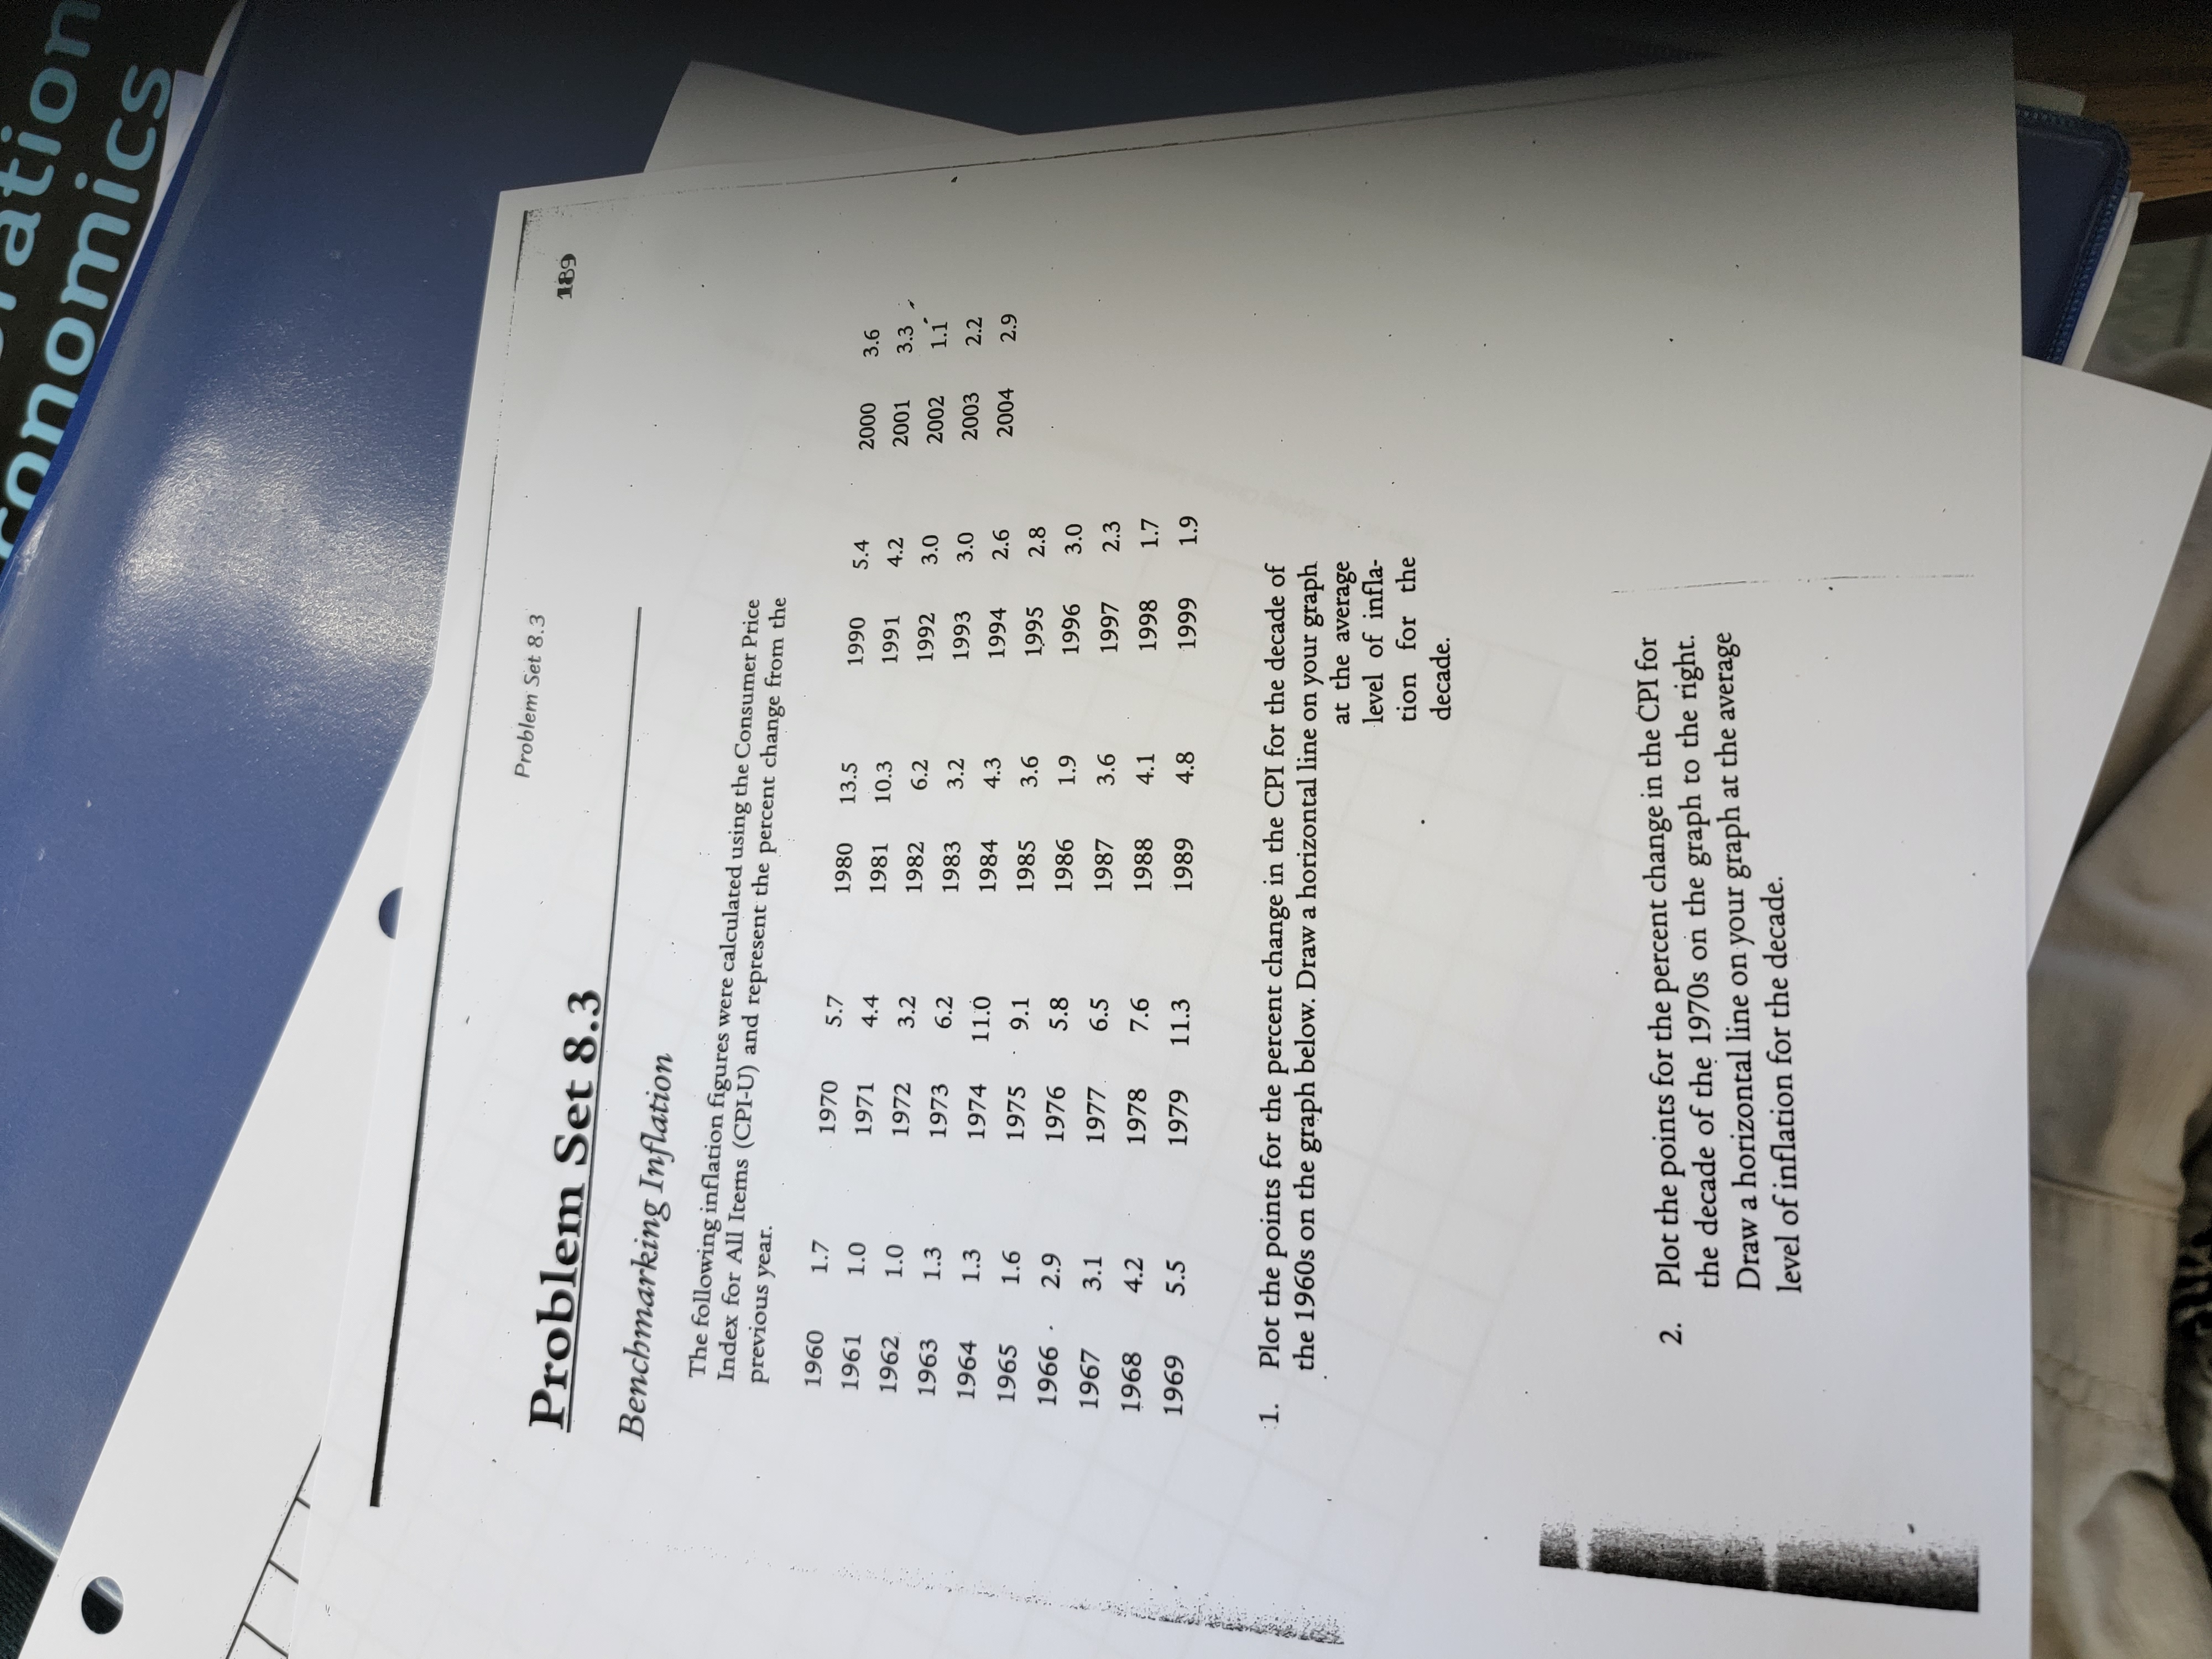
ation onomics Problem Set 8.3 189 Problem Set 8.3 Benchmarking Inflation The following inflation figures were calculated using the Consumer Price Index for All Items (CPI-U) and represent the percent change from the previous year. 1960 1.7 1970 5.7 1980 13.5 1990 5. 4 2000 3.6 1961 1.0 1971 4.4 1981 10.3 1991 4.2 2001 3.3 # 1962 1.0 1972 3.2 1982 6.2 1992 3.0 2002 1.1 1963 1.3 1973 6.2 1983 3.2 1993 3.0 2003 2.2 1964 1.3 1974 11.0 1984 4.3 1994 2.6 2004 2.9 1965 1.6 1975 9.1 1985 3.6 1995 2.8 1966 2.9 1976 5.8 1986 1.9 1996 3.0 1967 3.1 1977. 6.5 1987 3.6 1997 2.3 1968 4.2 1978 7.6 1988 4.1 1998 1.7 5.5 11.3 1989 4 8 1.9 1969 1979 1999 1. Plot the points for the percent change in the CPI for the decade of the 1960s on the graph below. Draw a horizontal line on your graph at the average level of infla- tion for the decade. 2. Plot the points for the percent change in the CPI for the decade of the 1970s on the graph to the right. Draw a horizontal line on your graph at the average level of inflation for the decade
Step by Step Solution
There are 3 Steps involved in it

Get step-by-step solutions from verified subject matter experts