

Question: Atomic Absorption Spectroscopy this is the lab name where we used old paint and lead. i dont have any better pictures. please answer the question
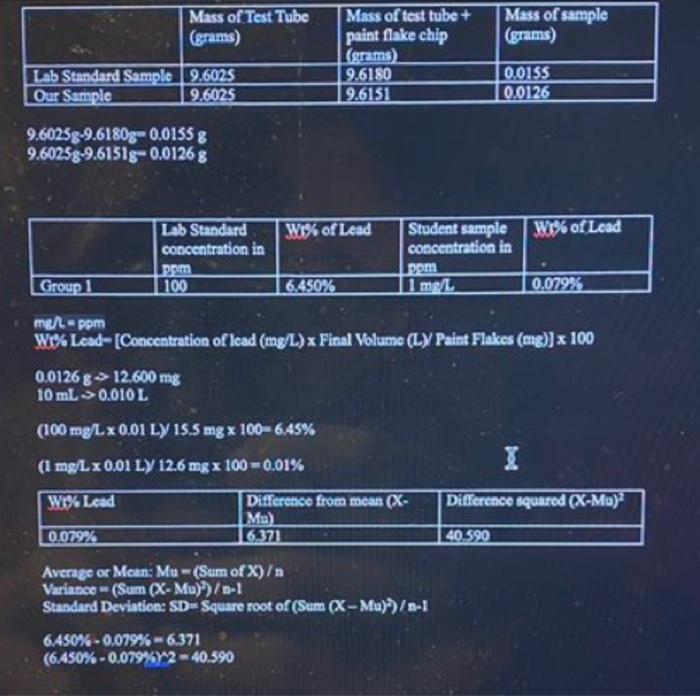
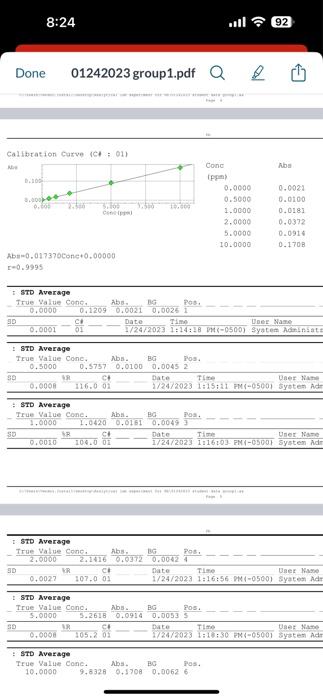
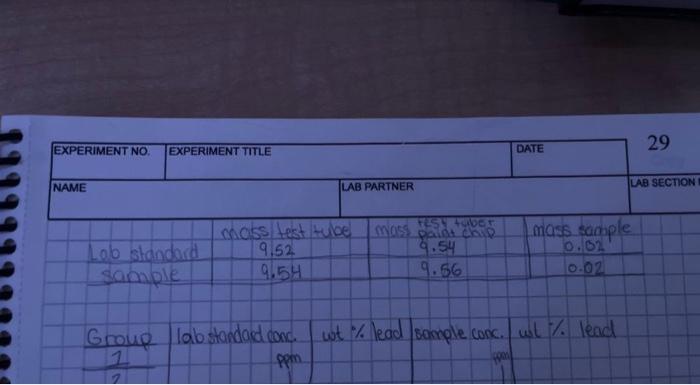
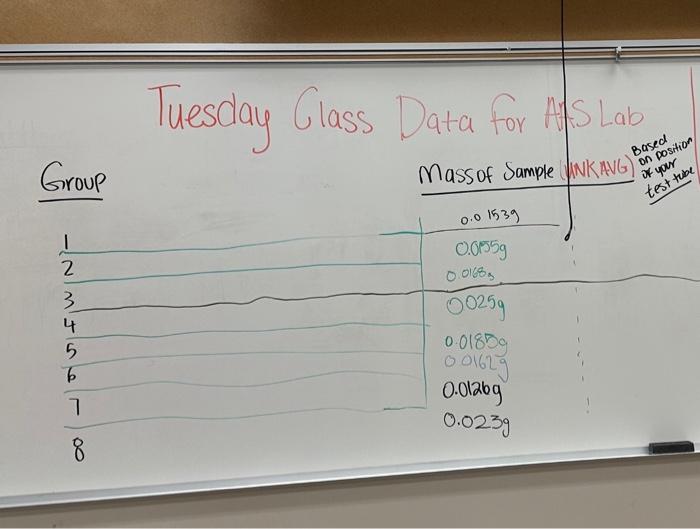
\begin{tabular}{|l|l|l|l|} \hline & MassofTestTube(grams) & Massoftesttube+paintflakechip(grams) & Massofsample(gams) \\ \hline Lab Standard Sample & 9.6025 & 9.6180 & 0.0155 \\ \hline Our Sample & 9.6025 & 9.6151 & 0.0126 \\ \hline \end{tabular} 9.6025g9.6180g=0.0155g9.6025g9.6151g0.0126g \begin{tabular}{|l|l|l|l|l|} \hline & LobStandardconcentrationinBrm & Wo\% of Lead & Studentsampleconcentratioainpema & Wo of Lead \\ \hline Group1 & 100 & 6.450% & 1mn/h & 0.079% \\ \hline \end{tabular} me/=ppmWo%Lead[Concentrationoflead(mgL)xFinalVolume(L)YPaintFlakes(mg)]x1000.0126812.600mg10mL0.010L(100mg/L0.01L)/15.5mg100=6.45%(1mg/L0.01L)12.6mg100=0.01% \begin{tabular}{|l|l|l|} \hline W Leed & Differencefroenmean(XMy) & Difference squared (XMu)2 \\ \hline 0.052% & 6.371 & 40.590 \\ \hline \end{tabular} Average or Mean: Mu =( Sum of X) Variasce =( Sum (XMu)2)/a1 Standard Deviation: SD = Square root of (Sum(XMu)2)1 6.450%0.079%=6.371(6.450%0.079%6)2=40.590 CaltbtationCurve{C+=01}AAben0.017370Concto.00000re0.9395 \begin{tabular}{|l|l|l|l|l|} \hline EXPERIMENT No. & EXPERIMENTTTILE & & 29 \\ \hline NAME & DATE & \\ \hline \end{tabular} Labstandardsamplemasstesttube9.529.54mass8.525+tyver0.029.56masssample0.02 Group labstandadeonc. wot % lead sample conc. wist % lead Tuesday Class Data for H.S Lab Discussion and Reporting Results: Your lab instructor will provide you with the data analysis of your sample and other students' sample. In your results and discussion, discuss the calculations you used to determine the percent Pb by weight and data you received in each paint sample. Compare the data you received from your sample to other students' samples and discuss factors that made that possible. For the Lab Standard samples, you should compare your results to what other students got and discuss why it varies
Step by Step Solution
There are 3 Steps involved in it

Get step-by-step solutions from verified subject matter experts