

Question: Attach a graph in Excel or PDF format with your baseline and treatment data. Scoring will be based on: Inclusion of baseline (.75 points) and
Attach a graph in Excel or PDF format with your baseline and treatment data.
Scoring will be based on:
Inclusion of baseline (.75 points) and treatment data (.75) on the same graph separated by a phase line.
Graph must be in APA style (.5 points) (Note: Please review the graphing video and the attached graphing checklist to ensure all criteria are met and your graph is in APA style).
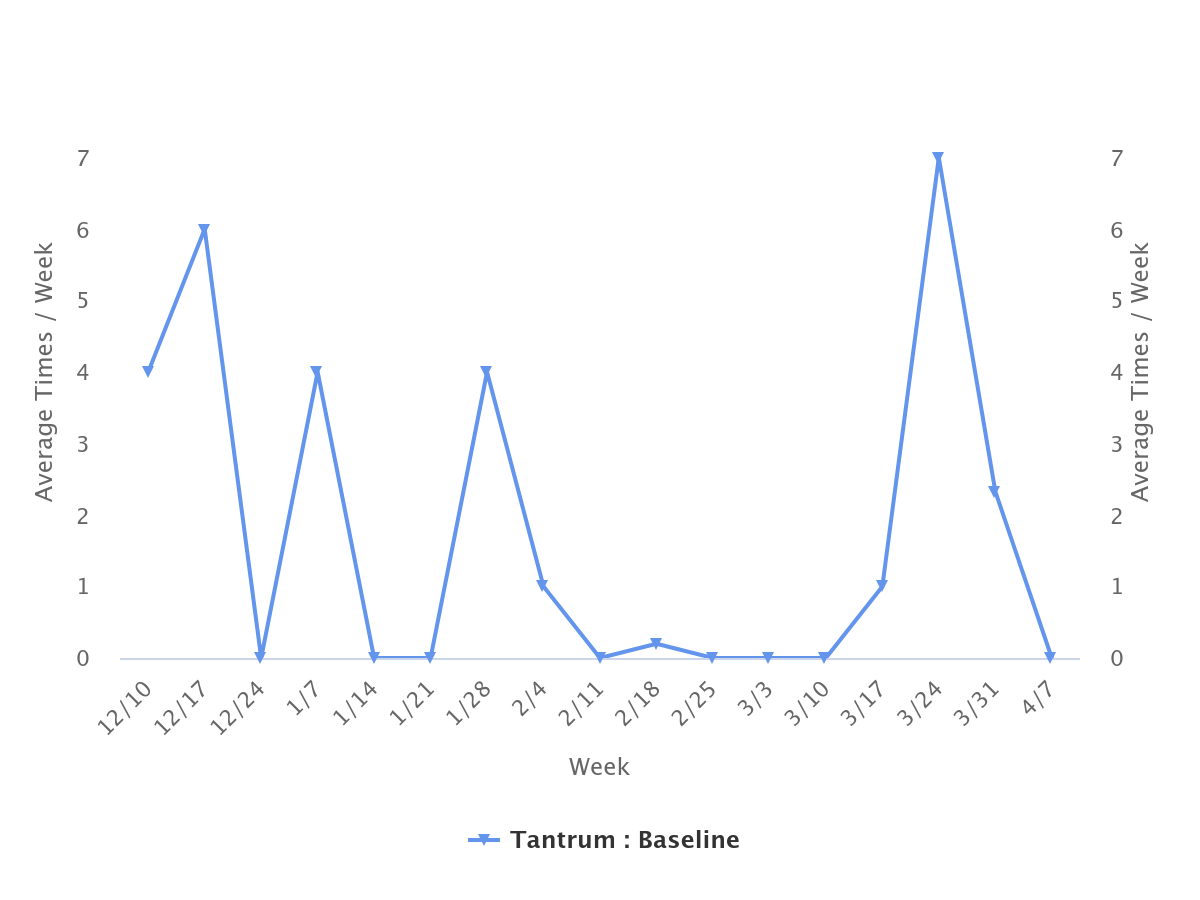
6 UT Average Times / Week 4 W 2 O 12/ LO 12/17 12/24 1/7 1/14 1/21 1/28 2/4 2/ 1 1 18 Week 25 - Tantrum : Baseline 3/3 UT 31 10 4 3/17 Average Times / Week 3 3/24 2 3/31 1 417
Step by Step Solution
There are 3 Steps involved in it
1 Expert Approved Answer
Step: 1 Unlock

Question Has Been Solved by an Expert!
Get step-by-step solutions from verified subject matter experts
Step: 2 Unlock
Step: 3 Unlock