

Question: Attached a picture to make it easier. The table below shows the frequency distribution of the weights (in grams) of pre-1964 quarters. Choose the correct
Attached a picture to make it easier.
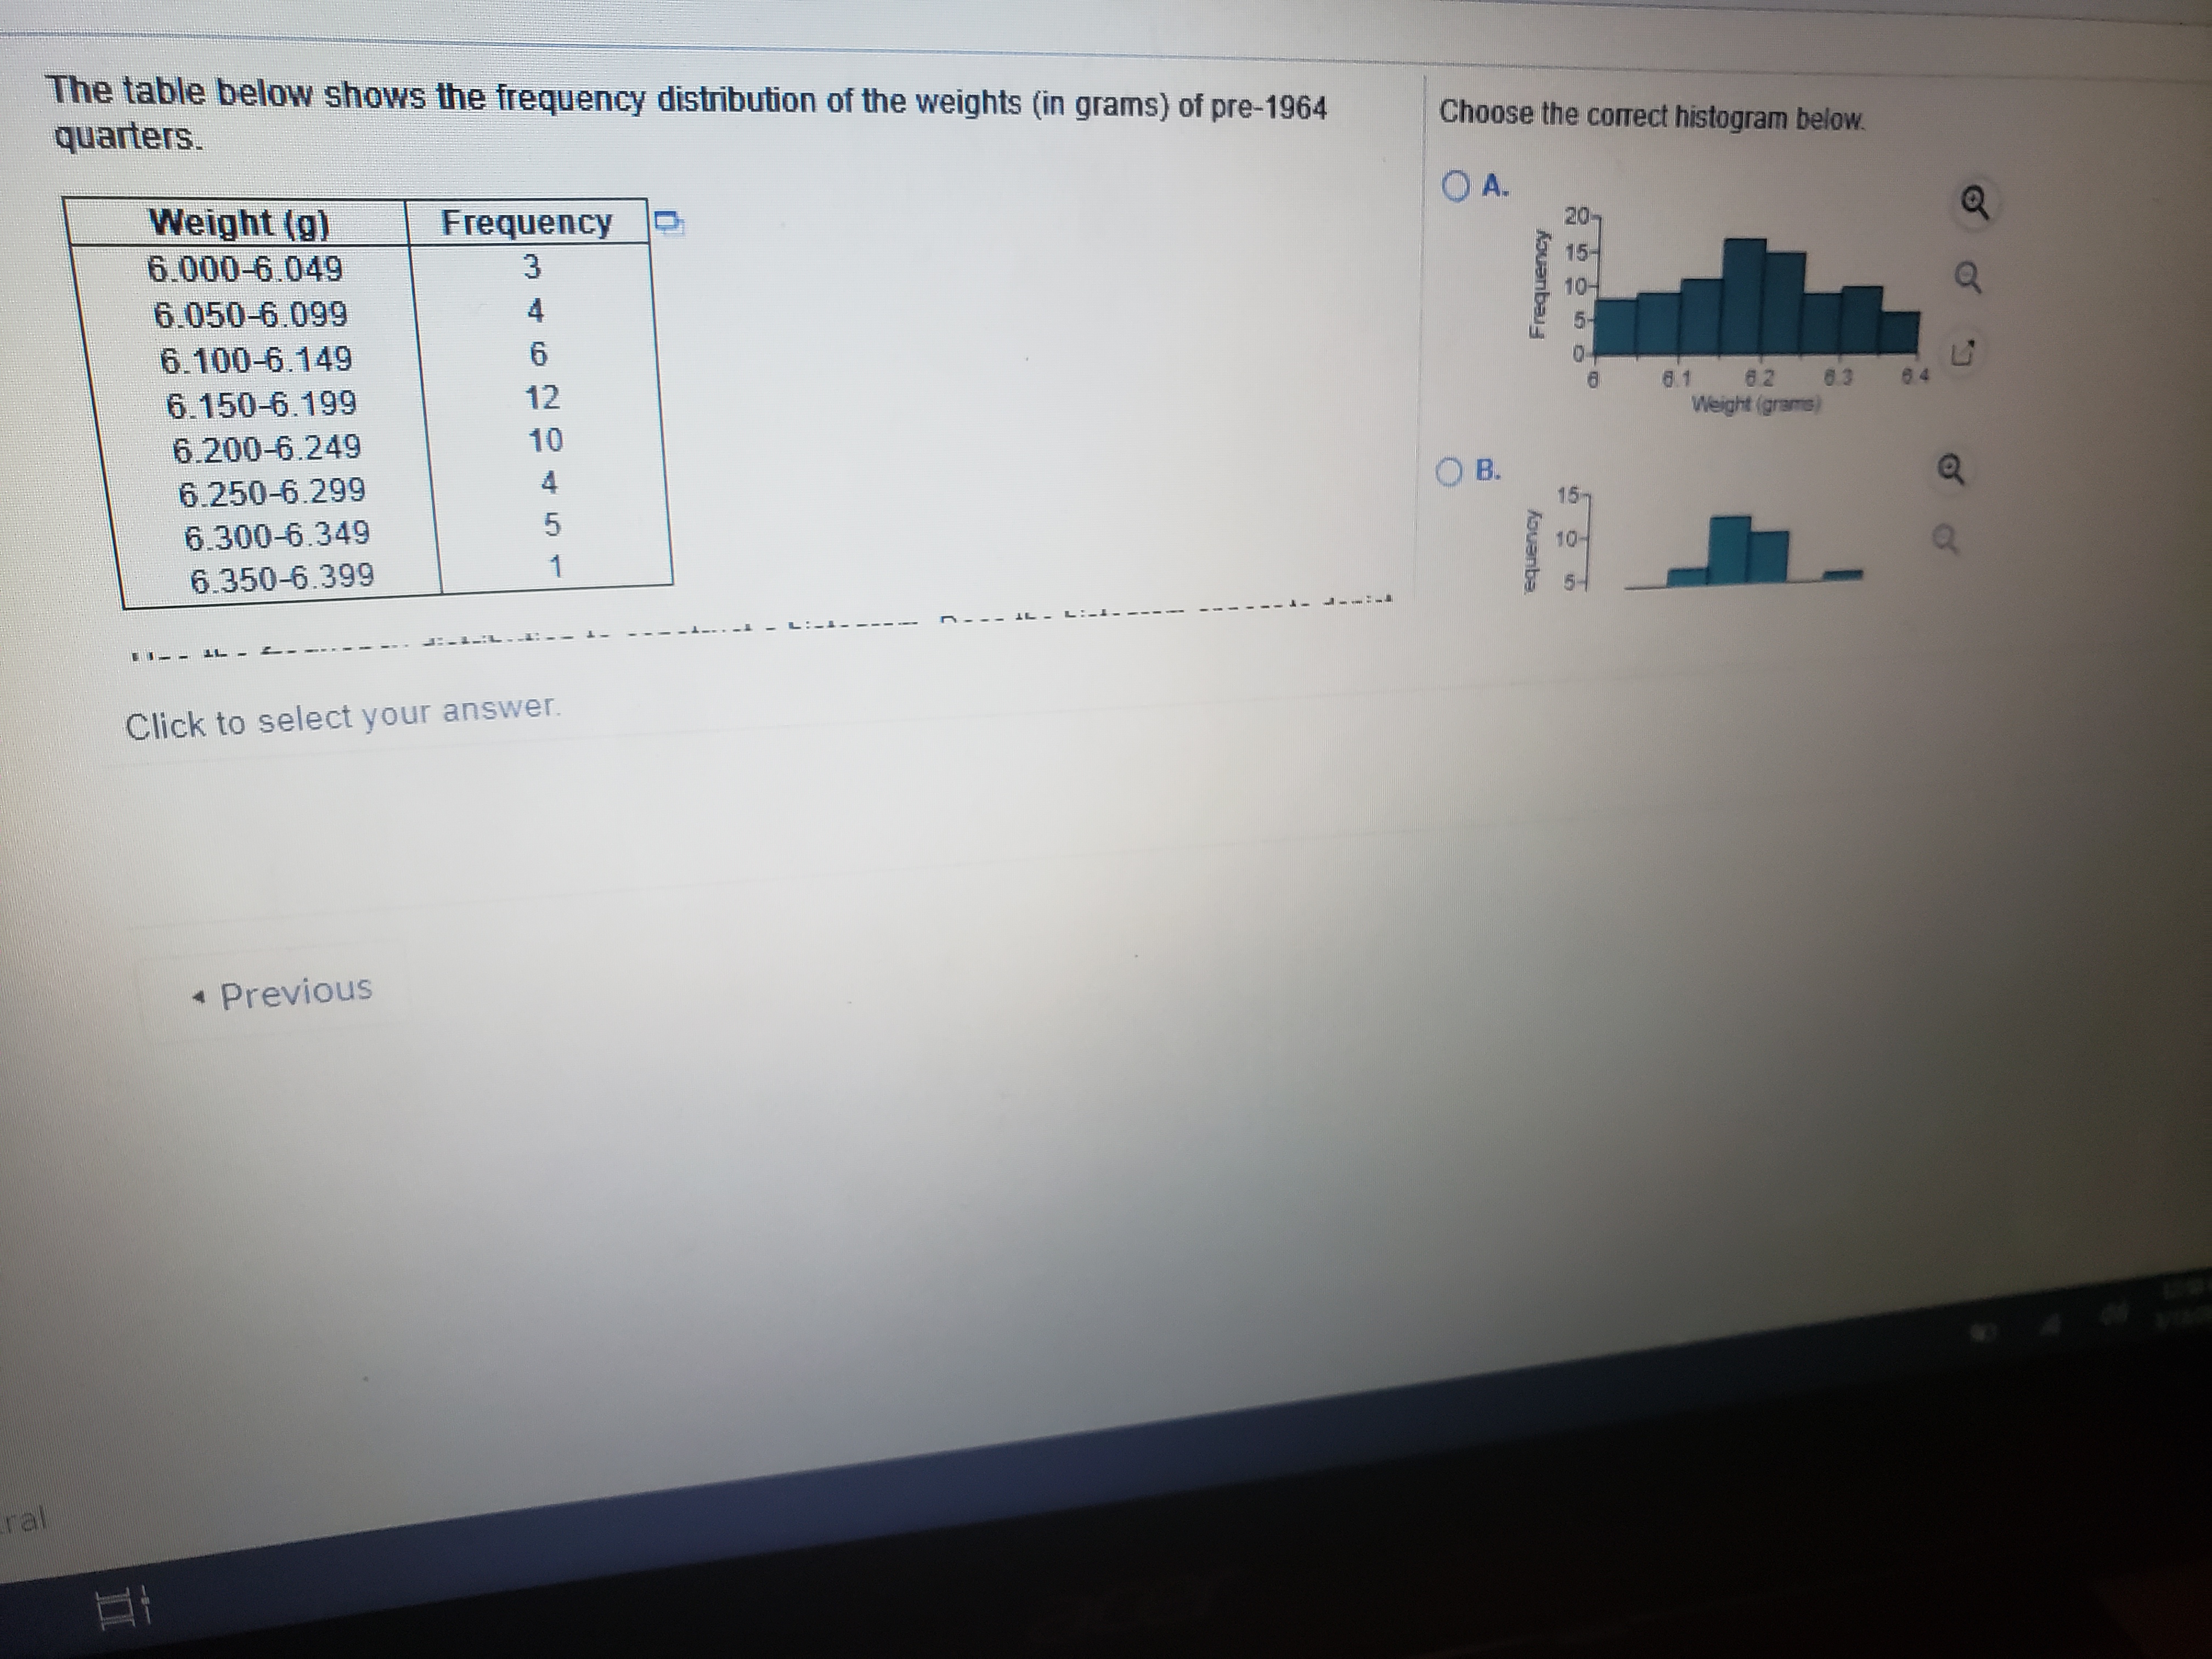
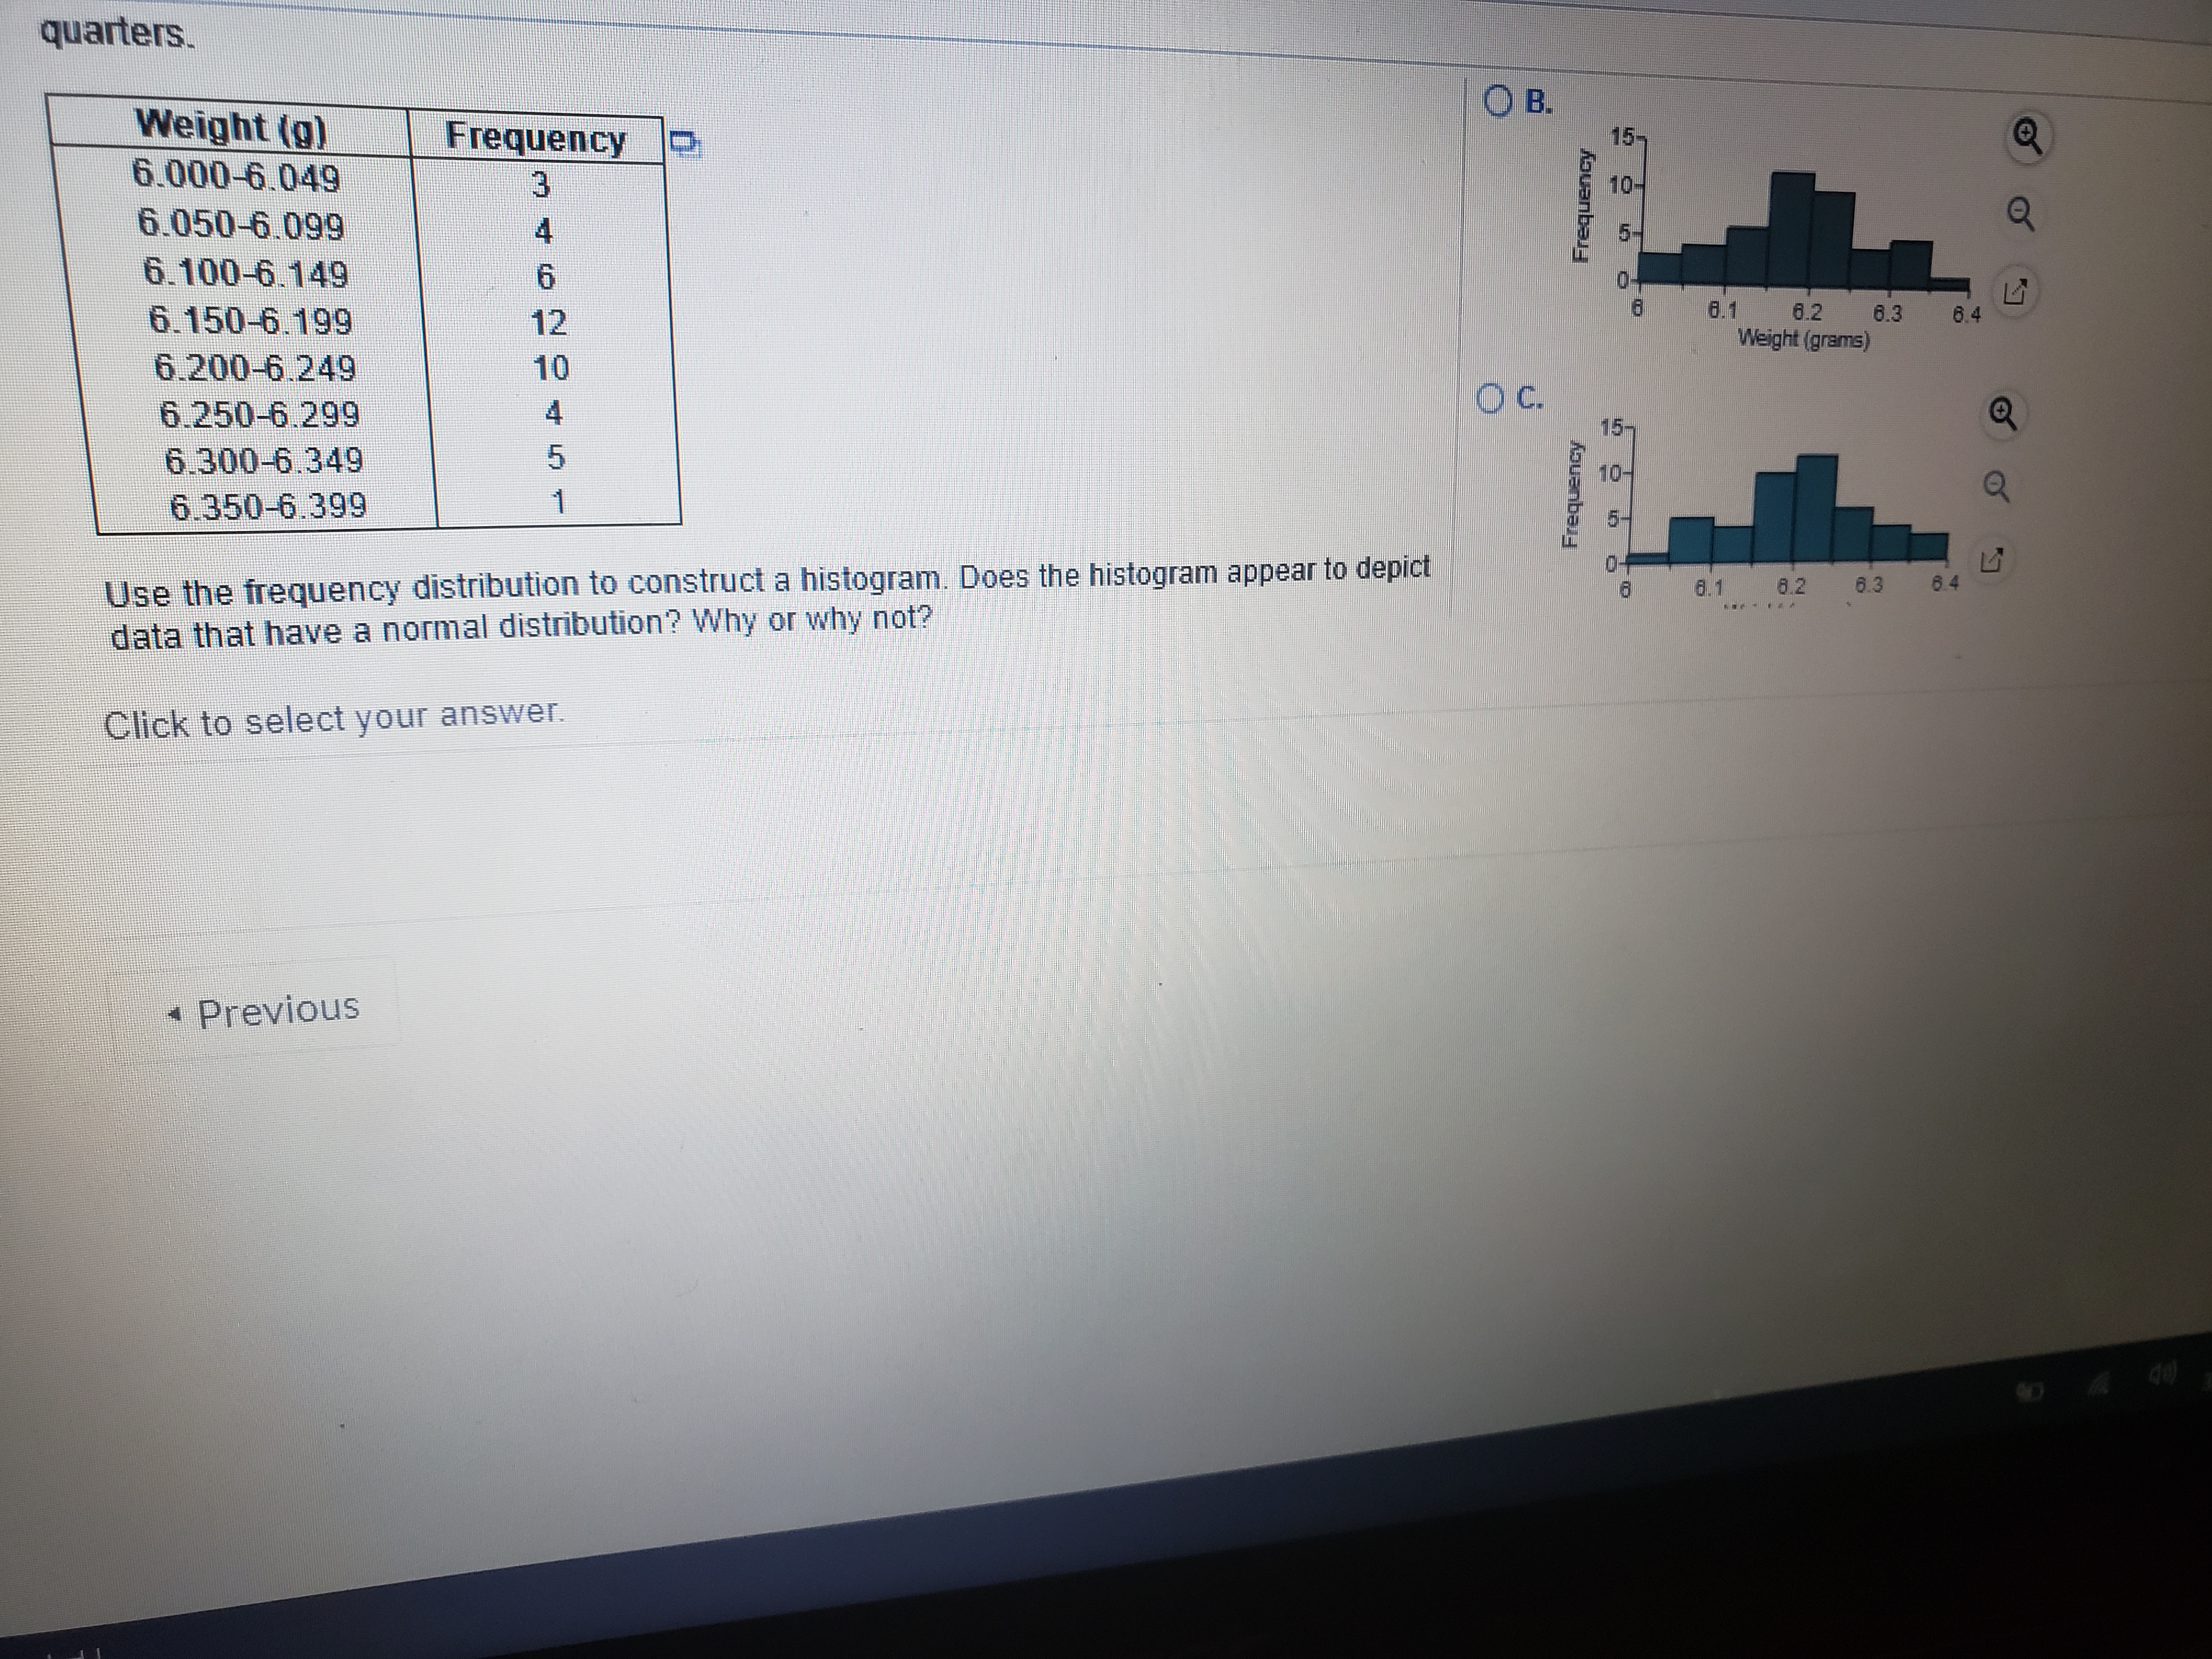
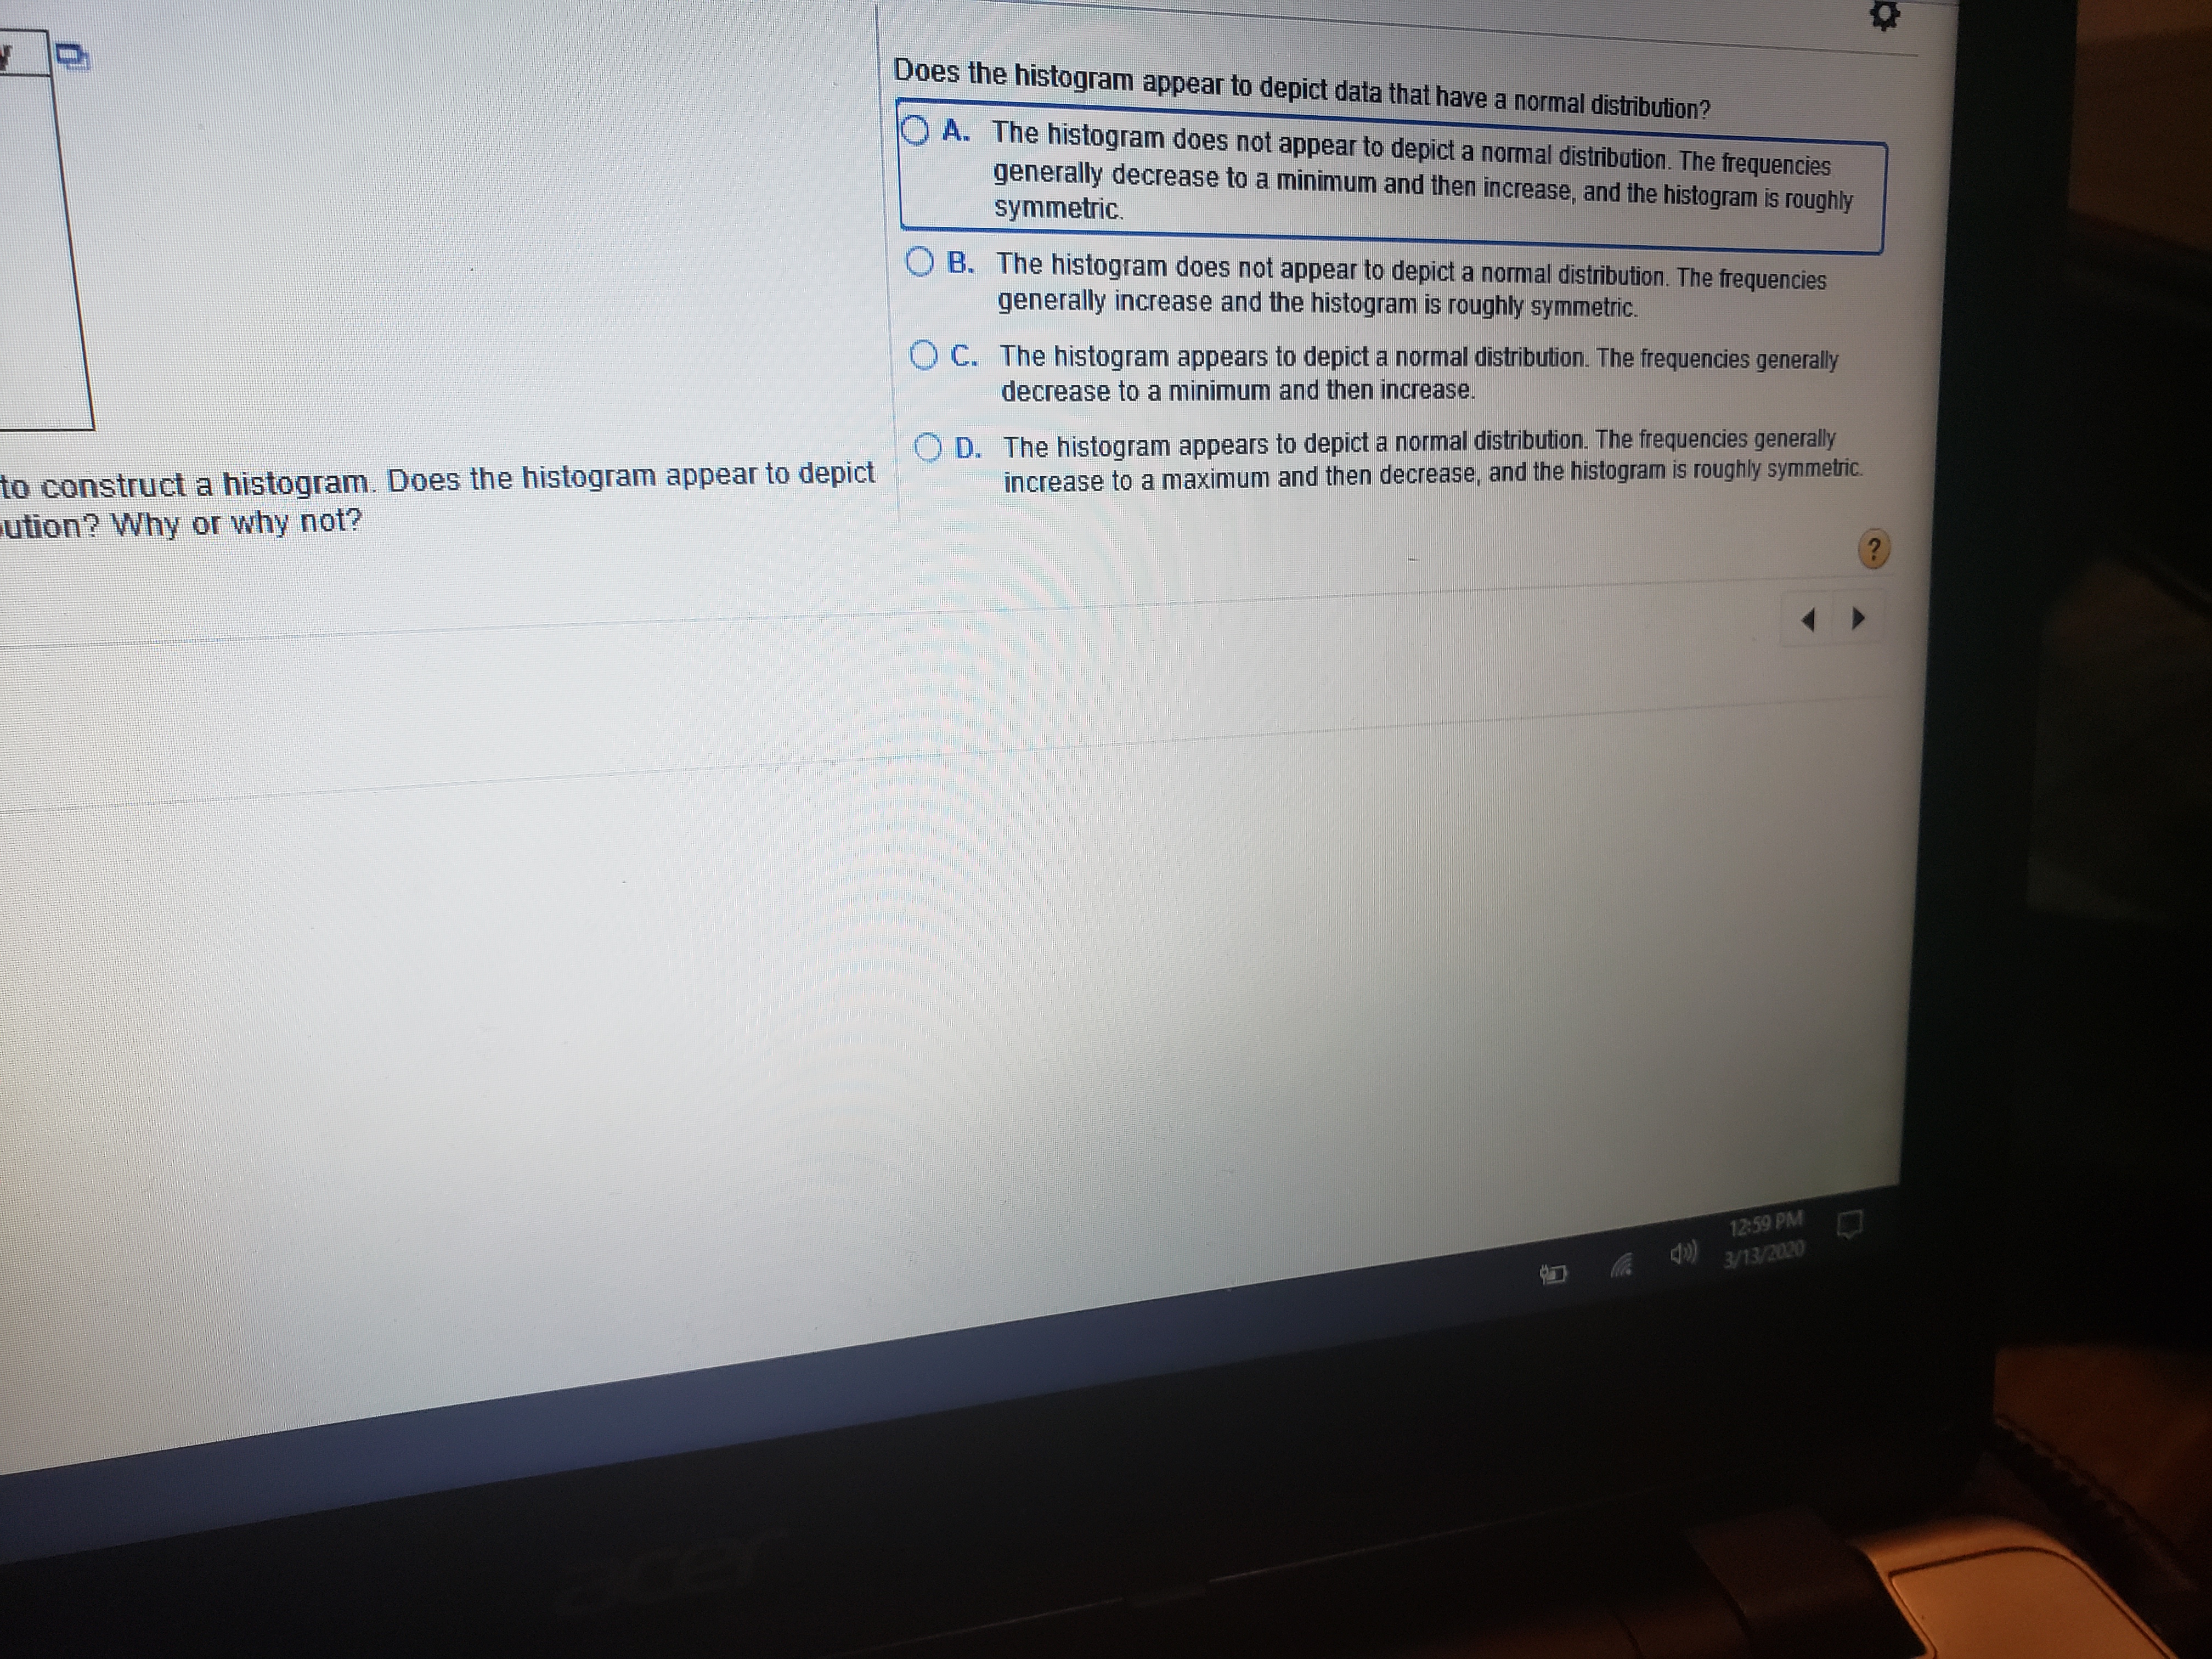
The table below shows the frequency distribution of the weights (in grams) of pre-1964 quarters. Choose the correct histogram below. Weight (g) Frequency OA. 20 6.000-6.049 Frequency 15- 6.050-6.099 10- 6.100-6.149 6 5- 6.150-6.199 12 62 83 6 4 6.200-6.249 10 Weight (grams) 6.250-6.299 4 O B. 6.300-6.349 6.350-6.399 equency 15 10- on Q Click to select your answer. . Previous ralquarters. O B. Weight (g) Frequency D 15- 6.000-6.049 6.050-6.099 6.100-6.149 Frequency 10- Q 6. 150-6.199 12 3.1 6.2 6.3 8.4 Weight (grams) 6.200-6.249 10 6.250-6.299 OC. Frequency 15 6.300-6.349 6.350-6.399 Use the frequency distribution to construct a histogram. Does the histogram appear to depict 6.1 10.2 6.3 8 4 data that have a normal distribution? Why or why not? Click to select your answer. . Previous 40)Does the histogram appear to depict data that have a normal distribution? O A. The histogram does not appear to depict a normal distribution. The frequencies generally decrease to a minimum and then increase, and the histogram is roughly symmetric. O B. The histogram does not appear to depict a normal distribution. The frequencies generally increase and the histogram is roughly symmetric. O C. The histogram appears to depict a normal distribution. The frequencies generally decrease to a minimum and then increase. D. The histogram appears to depict a normal distribution. The frequencies generally to construct a histogram. Does the histogram appear to depict increase to a maximum and then decrease, and the histogram is roughly symmetric ution? Why or why not? ? 12:59 PM 3/13/2020
Step by Step Solution
There are 3 Steps involved in it

Get step-by-step solutions from verified subject matter experts