

Question: attached all data and question th sig More Info Size of Sample Factor for UCL and LCL for x-chart (A) (n) 234569 8 Factors for
attached all data and question 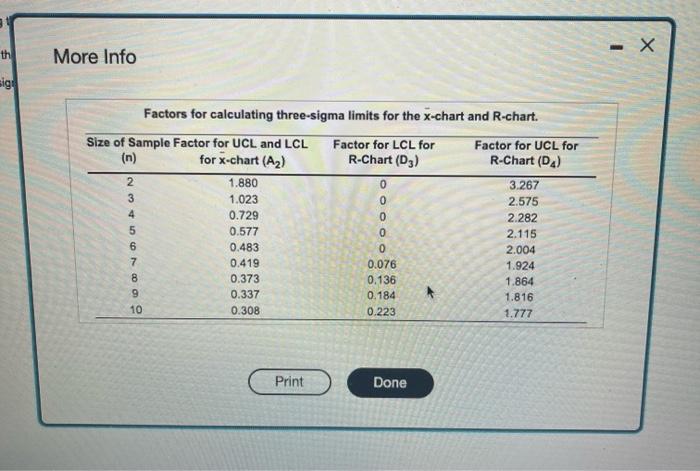
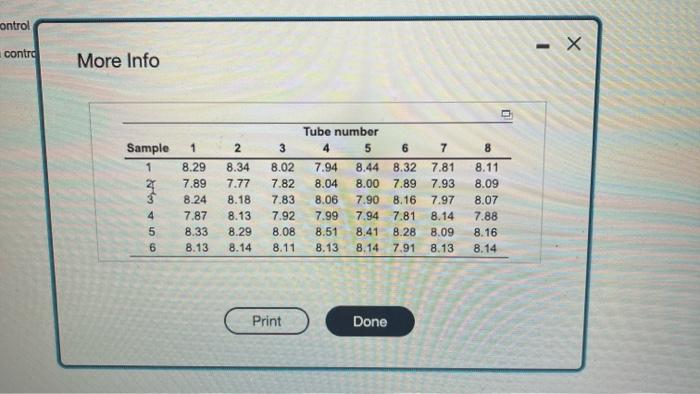
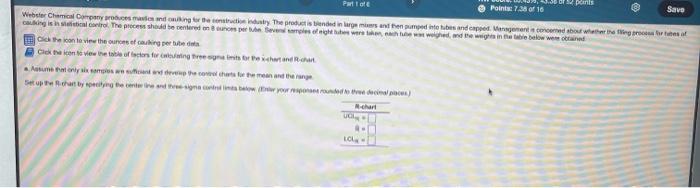
th sig More Info Size of Sample Factor for UCL and LCL for x-chart (A) (n) 234569 8 Factors for calculating three-sigma limits for the x-chart and R-chart. 10 1.880 1.023 0.729 0.577 0.483 0.419 0.373 0.337 0.308 Print Factor for LCL for R-Chart (D3) 0 0 0 0 0 0.076 0.136 0.184 0.223 Done Factor for UCL for R-Chart (D4) 3.267 2.575 2.282 2.115 2.004 1.924 1.864 1.816 1.777 - X control contro More Info Sample 1 1 12556 2 8.29 8.34 7.89 7.77 8.24 8.18 7.87 8.13 8.33 8.29 8.13 8.14 3 Tube number 3 4 8.02 7.94 7.82 8.04 8.00 7.89 7.83 8.06 7.92 8.08 8.11 Print 5 6 7 8.44 8.32 7.81 7.93 7.90 8.16 7.97 7.94 7.81 8.14 7.99 8.51 8.41 8.28 8.09 8.13 8.14 7.91 8.13 Done 8 8.11 8.09 8.07 7.88 8.16 8.14 I X Part of Points: 7.38 of 16 Webster Chemical Company produces masies and caulking for the construction industry. The product is blended in large mixers and then pumped into tibes and capped Management is concerned about whether the fing process for tubes of caulking is in statistical control. The process should be centered on 8 ounces per tube Seven samples of eight tubes were taken, nach tube was weighed, and the weights in the table below were obtained Click the icon to view the ounces of cauking per tube deta Ciek the icon to view the table of factors for calculating three ogna inits for the chart and Richar a Assume that only six samples are sufficient and develop the control charts for the mean and the range Set up the Richart by specifying the center ine and three signa contra lints below (Enlar your responses rounded to the decimal places) R-chart Uchy LO Save
Step by Step Solution
There are 3 Steps involved in it
1 Expert Approved Answer
Step: 1 Unlock

Question Has Been Solved by an Expert!
Get step-by-step solutions from verified subject matter experts
Step: 2 Unlock
Step: 3 Unlock