

Question: Attached are two data sets, one concerning Skittles and one about cereals. You may assume both samples provided were selected randomly and are representative of
Attached are two data sets, one concerning Skittles and one about cereals. You may assume both samples provided were selected randomly and are representative of the population. Be sure to use the correct data set with each of the following questions. Round all proportions to 4 decimal places, all means and standard deviations to 3 decimal places, all z-critical values and t-critical values to 2 decimal places, all z* values (z test statistic) to 2 decimal places, all t* values (t test statistic) to 1 decimal place, all P-values for hypothesis tests dealing with proportions to 4 decimal places, and all P-values for hypothesis tests dealing with means to 3 decimal places.
- Create a 99% confidence interval for the proportion of cereals that have more than 150mg of SODIUM per serving based on the samples provided.
- Use a hypothesis test to check if cereals have more than an average of 2g of PROTEIN. Use the attached data with a significance level of .05.
- Suppose that my favorite colors are RED and PURPLE, and I hate all other colors of Skittles. Is there enough evidence that given a random package of Skittles that the proportion of my FAVORITE COLORS will be less than the proportion of my HATED COLORS? Use the attached data with the significance level of .01.
- Find a 95% confidence interval that looks at the difference between the average number of RED Skittles in a package and the average number of ORANGE Skittles in a package based on the samples provided.
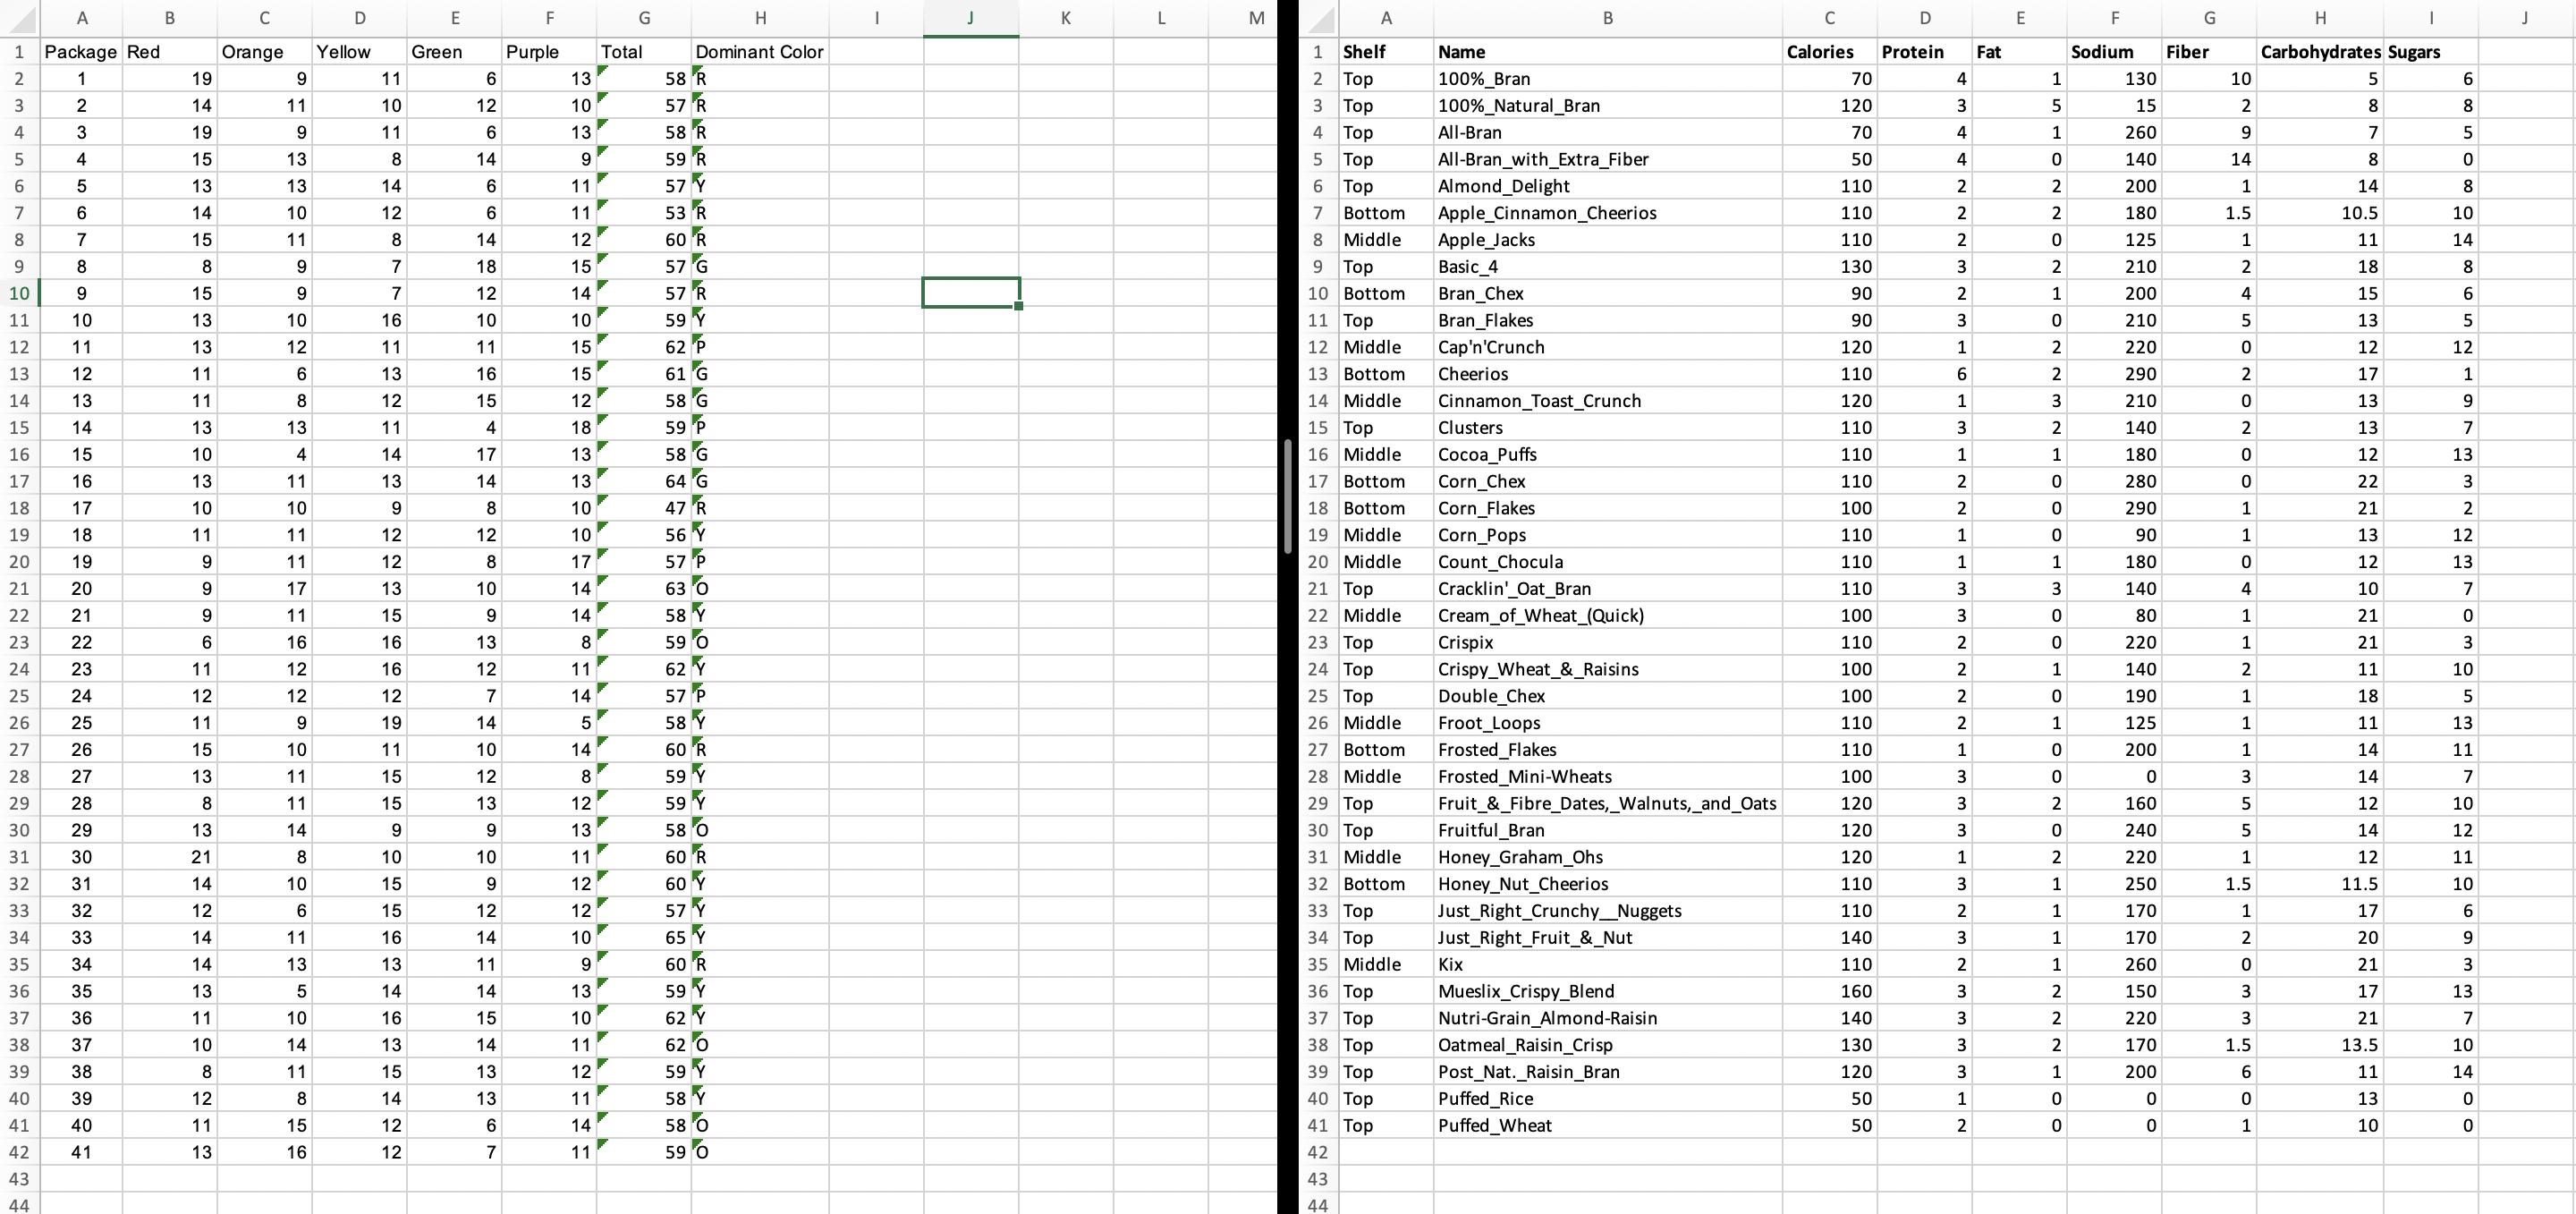
A C F G H K M A D E F H J Package Red Orange Yellow Green Purple Total Dominant Color 1 Shelf Name Calories Protein Fat Sodium Fiber Carbohydrates Sugars 58 R 100% Bran 100% Natural_Bran 2 1 19 9. 11 6 13 2 Top 70 4 1 130 10 6. 2 14 11 10 12 10 57 R 3 Top 120 15 2 8 8 4 3 19 9 11 6 13 58 R 4 Top All-Bran 70 1 260 9 7 5 4 15 13 8 14 59 R 5 op All-Bran_with_Extra_Fiber 50 4 140 14 6. 13 13 14 6 11 57 Y 6 Top Almond Delight 110 2 2 200 1 14 8 7 14 10 12 6 11 53 R 7 Bottom Apple_Cinnamon_Cheerios 110 2 2 180 1.5 10.5 10 8. 7 15 11 8 14 12 60 R 8. Middle Apple Jacks 110 125 1 11 14 9. 8 8 9. 7 18 15 57 G 9 Top Basic_4 130 210 18 8 10 15 7 12 14 57 R 10 Bottom Bran_Chex 90 2 1 200 4 15 11 10 13 10 16 10 10 59 Y 11 Top Bran_Flakes 90 210 13 12 11 13 11 11 15 62 P 12 Middle Cap'n'Crunch 120 1 2 220 12 12 13 12 11 13 16 15 61 G 13 Bottom Cheerios 110 6. 2 290 17 1 58 G 59 P 14 13 11 8 12 15 12 14 Middle Cinnamon_Toast_Crunch 120 1 210 13 15 14 13 13 11 4 18 15 Top Clusters 110 2 140 13 16 15 10 4 14 17 13 58 G 16 Middle a_Puffs 110 1 1 180 12 13 17 16 13 11 13 14 13 64 G 17 Bottom Corn_Chex 110 280 22 18 17 10 10 6. 8 10 47 'R 18 Bottom Corn_Flakes 100 2 290 1 21 2 19 18 11 11 12 12 10 56 19 Middle Corn Pops 110 1 90 1 13 12 20 19 11 12 17 57 P 20 Middle Count_Chocula 110 1 1 180 12 13 21 20 9. 17 13 10 14 63 0 21 Top Cracklin'_Oat_Bran 110 140 4 10 7 22 21 9. 11 15 14 58 Y 22 Middle Cream_of_Wheat_(Quick) 100 80 1 21 23 22 16 16 13 8 59 o 23 Top Crispix 110 2 220 1 21 62 24 Top Crispy_Wheat_&_Raisins Double_Chex Froot Loops Frosted_Flakes Frosted_Mini-Wheats Fruit &_Fibre_Dates,_Walnuts, and_Oats Fruitful Bran 24 23 11 12 16 12 11 100 2 1 140 11 10 25 24 12 12 12 7 14 57 P 25 Top 100 2 190 1 18 26 25 11 19 14 58 Y 26 Middle 110 2 1 125 1 11 13 27 26 15 10 11 10 14 60 R 27 Bottom 110 1 200 1 14 11 28 27 13 11 15 12 59 28 Middle 100 3 14 7 29 28 11 15 13 12 59 Y 29 Top 120 2 160 12 10 30 29 13 14 9 9 13 58 O 30 Top 120 240 5 14 12 60 R Honey_Graham_Ohs Honey Nut_Cheerios Just Right Crunchy Nuggets Just Right_Fruit_&_Nut 31 30 21 8 10 10 11 31 Middle 120 1 2 220 1 12 11 32 31 14 10 15 12 60 Y 32 Bottom 110 3 1 250 1.5 11.5 10 33 32 12 6 15 12 12 57 Y 33 o 110 2 1 170 1 17 6. 34 33 14 11 16 14 10 65 34 Top 140 1 170 20 9. 35 34 14 13 13 11 60 R 35 Middle Kix 110 2 1 260 21 59 Y Mueslix_Crispy_Blend Nutri-Grain_Almond-Raisin Oatmeal Raisin_Crisp Post Nat._Raisin_Bran Puffed_Rice Puffed_Wheat 36 35 13 14 14 13 36 Top 160 2 150 17 13 37 36 11 10 16 15 10 62 Y 37 Top 140 220 21 7 38 37 10 14 13 14 11 62 O 38 Top 130 2 170 1.5 13.5 10 39 38 8 11 15 13 12 59 Y 39 Top 120 1 200 6. 11 14 40 39 12 8 14 11 58 Y 40 Top 50 1 13 41 40 11 15 12 14 58 41 Top 50 2 1 10 42 41 13 16 12 7 11 59 O 42 43 43 44 44 I M M O N O O N o c
Step by Step Solution
3.52 Rating (165 Votes )
There are 3 Steps involved in it
Lets tackle each question step by step 1 Create a 99 confidence interval for the proportion of cereals that have more than 150mg of SODIUM per serving ... View full answer

Get step-by-step solutions from verified subject matter experts