

Question: attached below are the year 4ratios below are the year 3 ratios thanks you QUESTION 1 Required: You have been asked by your company's Board
attached below are the year 4ratios
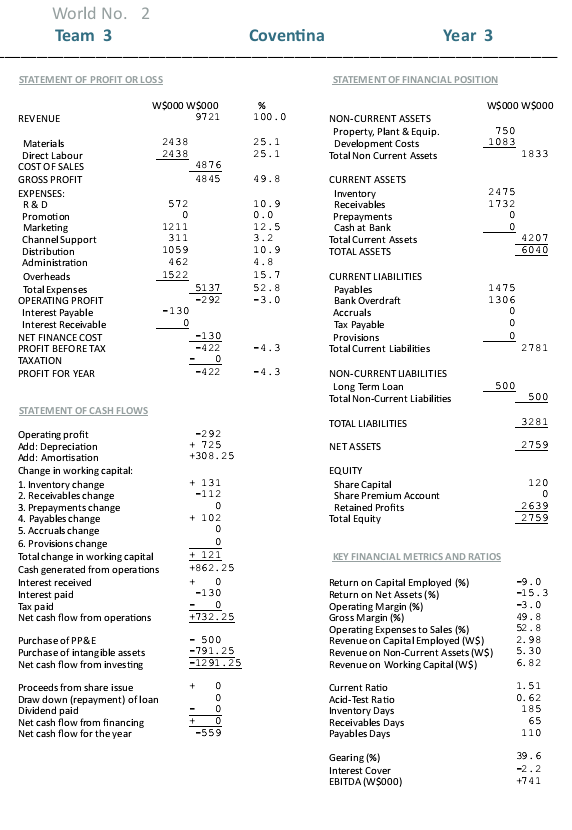
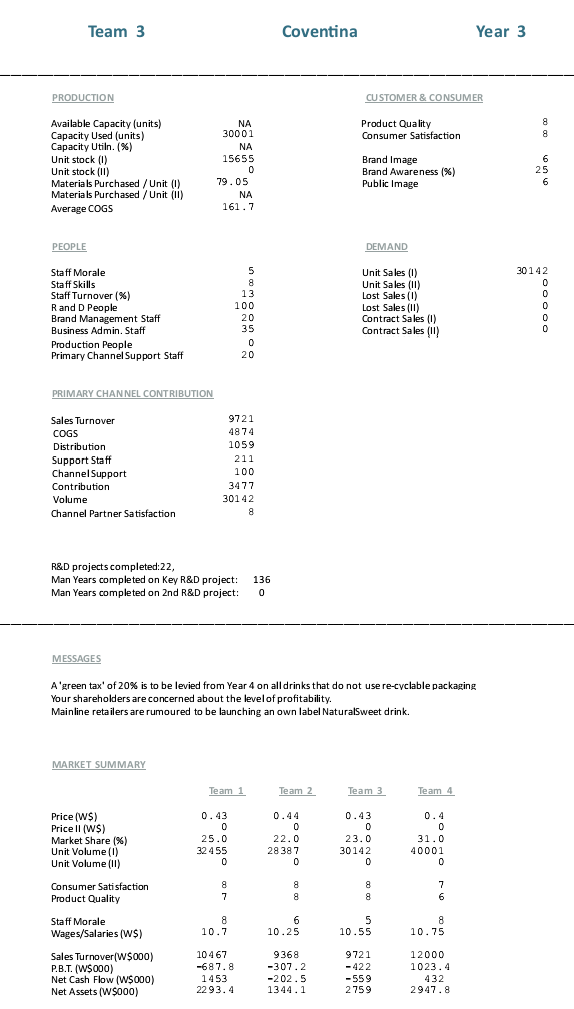
below are the year 3 ratios
thanks you
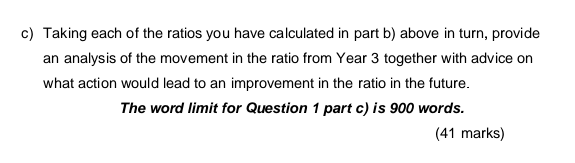
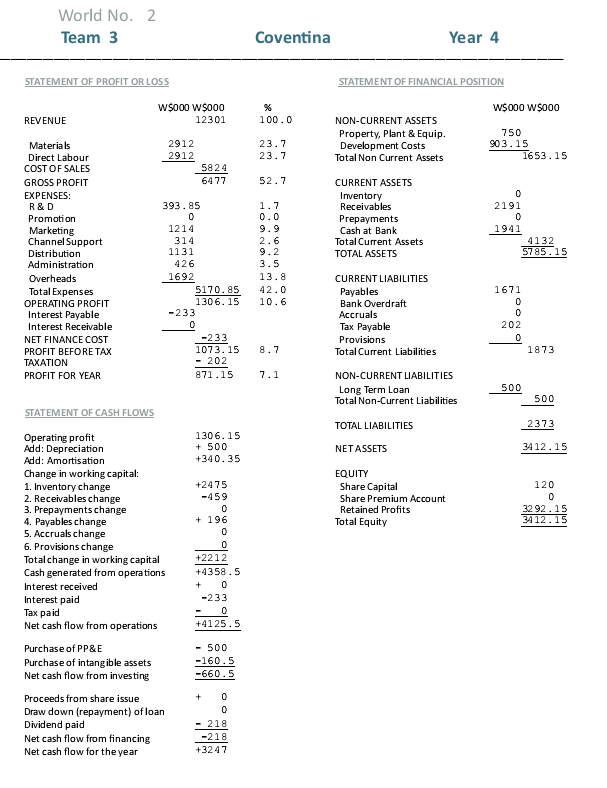
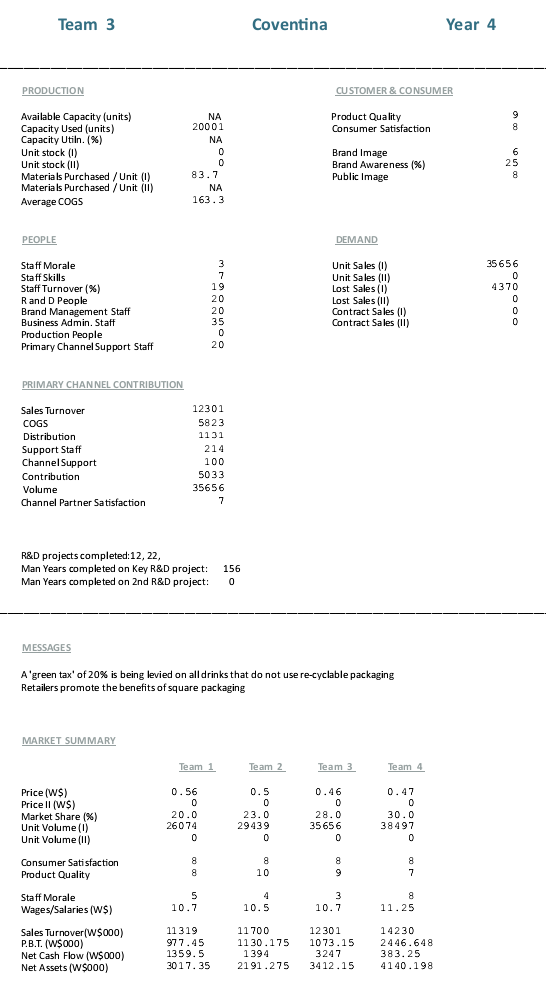
QUESTION 1 Required: You have been asked by your company's Board of Directors to provide an analysis of six of your company's key financial ratios for Year 4 compared with Year 3. a) Provide the following information: a. Your company's World number (1, 2, 3 or 4) b. Your company's business name (Team A, Team B, Team C or Team D). (1 mark) b) Provide calculations and supporting workings for the following six financial ratios for your business for Year 4: i. Return on capital employed ii. Operating profit margin ii. Gross profit margin iv. Sales revenue on capital employed V. Acid-test ratio vi. Gearing ratio (18 marks) c) Taking each of the ratios you have calculated in part b) above in turn, provide an analysis of the movement in the ratio from Year 3 together with advice on what action would lead to an improvement in the ratio in the future. The word limit for Question 1 part c) is 900 words. (41 marks) World No. 2 Team 3 Coventina Year 4 STATEMENT OF PROFIT OR LOSS STATEMENT OF FINANCIAL POSITION W$ 000 w$000 w$000 W$000 12301 % 100.0 REVENUE NON-CURRENT ASSETS Property, Plant & Equip. Development Costs Total Non Current Assets 2912 2912 23.7 23.7 750 903.15 1653.15 5824 64 77 52.7 CURRENT ASSETS Inventory Receivables Prepayments Cash at Bank Total Current Assets TOTAL ASSETS Materials Direct Labour COST OF SALES GROSS PROFIT EXPENSES: R&D Promotion Marketing Channel Support Distribution Administration Overheads Total Expenses OPERATING PROFIT Interest Payable Interest Receivable NET FINANCE COST PROFIT BEFORE TAX TAXATION PROFIT FOR YEAR 0 2191 0 1941 4132 5785.15 1.7 0.0 9.9 2.6 9.2 3.5 13.8 42.0 10.6 393.85 0 1214 314 1131 426 1692 5170.85 1306. 15 -233 0 -233 1073.15 - 202 871.15 1671 0 NOC CURRENT LIABILITIES Payables Bank Overdraft Accruals Tax Payable Provisions Total Current Liabilities NON-CURRENT LIABILITIES Long Term Loan Total Non-Current Liabilities 202 0 1873 8.7 7.1 500 500 STATEMENT OF CASH FLOWS TOTAL LIABILITIES 2373 1306.15 + 500 +340.35 NET ASSETS 34 12.15 EQUITY Share Capital Share Premium Account Retained Profits Total Equity 120 0 32 92.15 34 12.15 Operating profit Add: Depreciation Add: Amortisation Change in working capital: 1. Inventory change 2. Receivables change 3. Prepayments change 4. Payables change 5. Accruals change 6. Provisions change Totalchange in working capital Cash generated from operations Interest received Interest paid Tax paid Net cash flow from operations Purchase of PP&E Purchase of intangible assets Net cash flow from investing Proceeds from share issue Draw down (repayment) of loan Dividend paid Net cash flow from financing Net cash flow for the year +2475 -459 0 + 196 0 0 +2212 +4358.5 + 0 -233 0 +41 25.5 - 500 -160.5 -660.5 + 0 0 - 218 -218 +3247 Team 3 Coventina Year 4 PRODUCTION CUSTOMER & CONSUMER Product Quality Consumer Satisfaction 9 8 Available Capacity (units) Capacity Used (units) Capacity Utiln. (%) Unit stock (0) Unit stock (11) Materials Purchased / Unit (1) Materials Purchased / Unit (11) Average COGS NA 20001 NA 0 9 0 83.7 NA 163.3 Brand Image Brand Awareness (%) Public Image 6 25 8 PEOPLE DEMAND Staff Morale Staff Skills Staff Turnover (%) R and D People Brand Management Staff Business Admin. Staff Production People Primary Channel Support Staff 3 7 19 20 20 35 0 20 Unit Sales (0) Unit Sales (1) Lost Sales (0) Lost Sales (11) Contract Sales (0) Contract Sales (11) 35656 0 4370 0 0 0 PRIMARY CHANNEL CONTRIBUTION Sales Turnover COGS Distribution Support Staff Channel Support Contribution Volume Channel Partner Satisfaction 12301 58 23 1131 214 100 5033 35656 7 R&D projects completed:12, 22, Man Years completed on Key R&D project: R Man Years completed on 2nd R&D project: 156 0 MESSAGES A'green tax' of 20% is being levied on all drinks that do not use re-cyclable packaging Retailers promote the benefits of square packaging MARKET SUMMARY Team 1 Team 2 Team 3 Team 4 Price (WS) Price II (WS) Market Share (%) Unit Volume (1) Unit Volume (II) 0.56 0 0 20.0 260 74 C 0.5 0 23.0 29439 0 0.46 0 28.0 35656 0 0.47 0 30.0 38497 0 Consumer Satisfaction Product Quality 8 8 8 8 10 8 8 9 8 7 5 10.7 4 10.5 3 10.7 8 11.25 Staff Morale Wages/Salaries (W$) Sales Turnover(W$000) P.B.T. (W$000) Net Cash Flow (W$000) Net Assets (W $000) 12301 1073.15 11 319 977.45 1359.5 3017. 35 11700 11 30.175 1394 2191.275 3247 14230 2446.648 383.25 4140.198 3412.15 World No. 2 Team 3 Coventina Year 3 STATEMENT OF PROFIT OR LOSS STATEMENT OF FINANCIAL POSITION W$000 W$000 9721 W$000 W$000 % 100.0 REVENUE 2438 2438 25.1 25.1 NON-CURRENT ASSETS Property, Plant & Equip. Development Costs Total Non Current Assets 750 1083 1833 4976 4845 49.8 10.9 0.0 12.5 3.2 10.9 CURRENT ASSETS Inventory Receivables Prepayments Cash at Bank Total Current Assets TOTAL ASSETS 2475 1732 0 0 4207 6040 Materials Direct Labour COST OF SALES GROSS PROFIT EXPENSES: R&D Promotion Marketing Channel Support Distribution Administration Overheads Total Expenses OPERATING PROFIT Interest Payable Interest Receivable NET FINANCE COST PROFIT BEFORE TAX TAXATION PROFIT FOR YEAR 572 0 1211 311 1059 462 1522 5137 -292 -130 0 -130 -422 - 0 -422 15.7 52.8 -3.0 1475 1306 CURRENT LIABILITIES Payables Bank Overdraft Accruals Tax Payable Provisions Total Current Liabilities 0 0 -4.3 2781 -4.3 NON-CURRENT LIABILITIES Long Term Loan Total Non-Current Liabilities 500 500 STATEMENT OF CASH FLOWS TOTAL LIABILITIES 3281 -292 + 725 +308. 25 NET ASSETS 2755 EQUITY Share Capital Share Premium Account Retained Profits Total Equity 120 0 2639 2755 Operating profit Add: Depreciation Add: Amortisation Change in working capital: 1. Inventory change 2. Receivables change 3. Prepayments change 4. Payables change 5. Accruals change 6. Provisions change Totalchange in working capital Cash generated from operations Interest received Interest paid Tax paid Net cash flow from operations Purchase of PP&E Purchase of intangible assets Net cash flow from investing Proceeds from share issue Draw down (repayment) of loan Dividend paid Net cash flow from financing Net cash flow for the year KEY FINANCIAL METRICS AND RATIOS + 131 -112 0 + 102 0 0 + 121 +862.25 + 0 -130 0 +732.25 -9.0 -15.3 -3.0 49.8 52.8 2.98 5.30 6.82 - 500 -791.25 -1291.25 + 0 OOOOO Return on Capital Employed (%) Return on Net Assets (%) Operating Margin (%) Gross Margin (%) Operating Expenses to Sales (%) Revenue on Capital Employed (W$) Revenue on Non-Current Assets (W$) Revenue on Working Capital (W$) Current Ratio Acid-Test Ratio Inventory Days Receivables Days Payables Days Gearing (%) Interest Cover EBITDA (W5000) 1.51 0.62 185 65 110 + 0 -555 39.6 -2.2 +741 Team 3 Coventina Year 3 PRODUCTION CUSTOMER & CONSUMER Product Quality Consumer Satisfaction 8 8 Available Capacity (units) Capacity Used (units) Capacity Utiln. (%) Unit stock (0) Unit stock (11) Materials Purchased / Unit (0) Materials Purchased / Unit (ll) Average COGS NA 30001 NA 15655 0 79.05 NA 161.7 Brand Image Brand Awareness (%) Public Image 6 25 6 PEOPLE DEMAND Staff Morale Staff Skills Staff Turnover (%) Rand D People Brand Management Staff Business Admin. Staff Production People Primary Channel Support Staff 5 8 13 100 20 35 0 0 20 Unit Sales (0) Unit Sales (11) Lost Sales (0) Lost Sales (11) Contract Sales (0) Contract Sales (1) 30142 0 0 0 0 0 PRIMARY CHANNEL CONTRIBUTION Sales Turnover COGS Distribution Support Staff Channel Support Contribution Volume Channel Partner Satisfaction 9721 48 74 1059 211 100 3477 30142 8 R&D projects completed:22, Man Years completed on Key R&D project: Man Years completed on 2nd R&D project: 136 0 MESSAGES A'green tax' of 20% is to be levied from Year 4 on all drinks that do not use re-cyclable packaging Your shareholders are concerned about the level of profitability. Mainline retailers are rumoured to be launching an own label NaturalSweet drink. MARKET SUMMARY Team 1 Team 2 Team 3 Team 4 Price (WS) Price II (WS) Market Share (%) Unit Volume (0) Unit Volume (11) ) Consumer Satisfaction Product Quality 0.43 0 25.0 32 455 0 0 0.44 0 22.0 28 387 0 0 0.43 0 23.0 30142 0 O 0.4 0 0 31.0 40001 0 8 7 8 8 8 8 8 7 6 Staff Morale Wages/Salaries (WS) 8 10.7 6 10.25 5 10.55 8 10.75 Sales Turnover(W$000) P.B.T. (W$000) Net Cash Flow (W$000) Net Assets (5000) 10467 -68 7.8 1453 2293.4 9368 -307.2 -202.5 1344.1 9721 -422 -559 2759 12000 1023.4 432 2947.8
Step by Step Solution
There are 3 Steps involved in it

Get step-by-step solutions from verified subject matter experts