

Question: Attached Files: 0 Control Charts ( 1 ) . pptx A ( 4 9 5 . 3 6 3 KB ) Read the PowerPoint document
Attached Files:
Control Charts pptx A KB
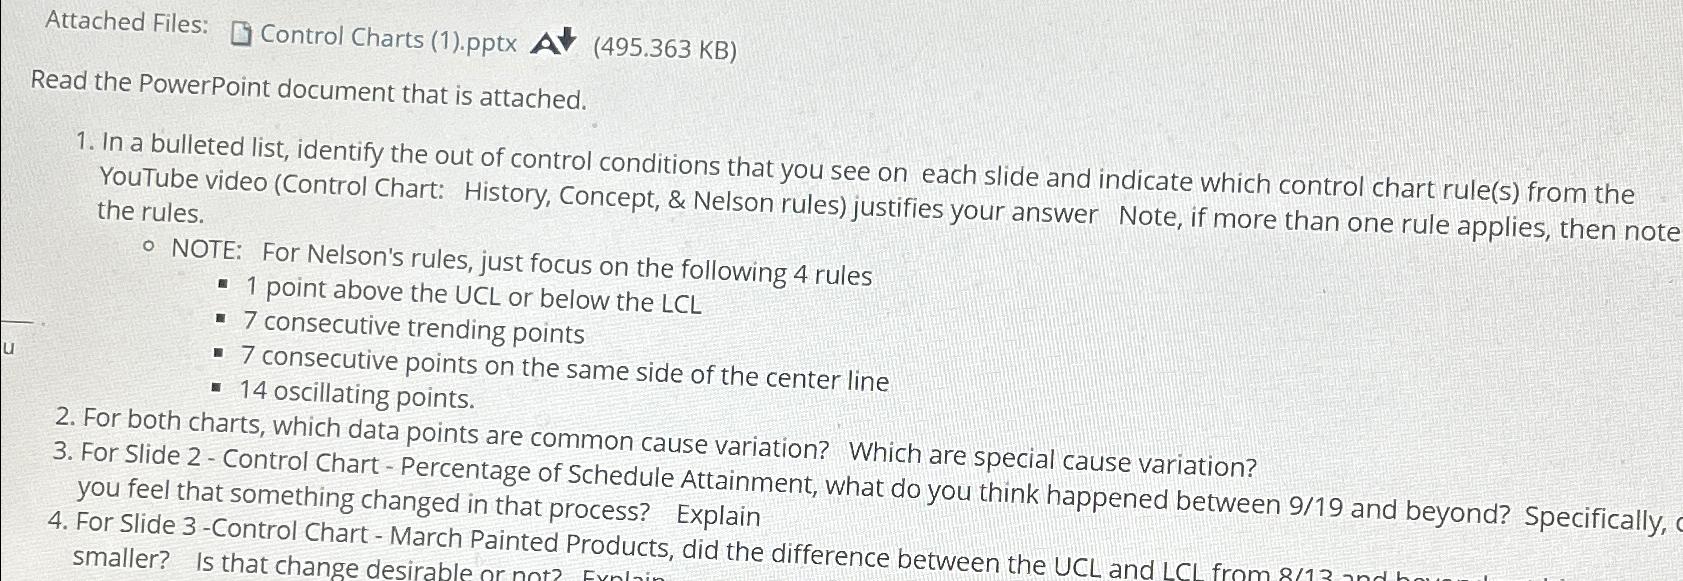
Read the PowerPoint document that is attached.
In a bulleted list, identify the out of control conditions that you see on each slide and indicate which control chart rules from the YouTube video Control Chart: History, Concept, & Nelson rules justifies your answer Note, if more than one rule applies, then note the rules.
NOTE: For Nelson's rules, just focus on the following rules
point above the UCL or below the LCL
consecutive trending points
consecutive points on the same side of the center line
oscillating points.
For both charts, which data points are common cause variation? Which are special cause variation?
For Slide Control Chart Percentage of Schedule Attainment, what do you think happened between and beyond? Specifically, you feel that something changed in that process? Explain
For Slide Control ChartMarch Painted Products, did the difference between smaller? Is that change desirable or not?
Step by Step Solution
There are 3 Steps involved in it
1 Expert Approved Answer
Step: 1 Unlock

Question Has Been Solved by an Expert!
Get step-by-step solutions from verified subject matter experts
Step: 2 Unlock
Step: 3 Unlock