

Attached is a list containing 22 of the most prevalent brands in the fashion industry in...
Fantastic news! We've Found the answer you've been seeking!
Question:
Transcribed Image Text:
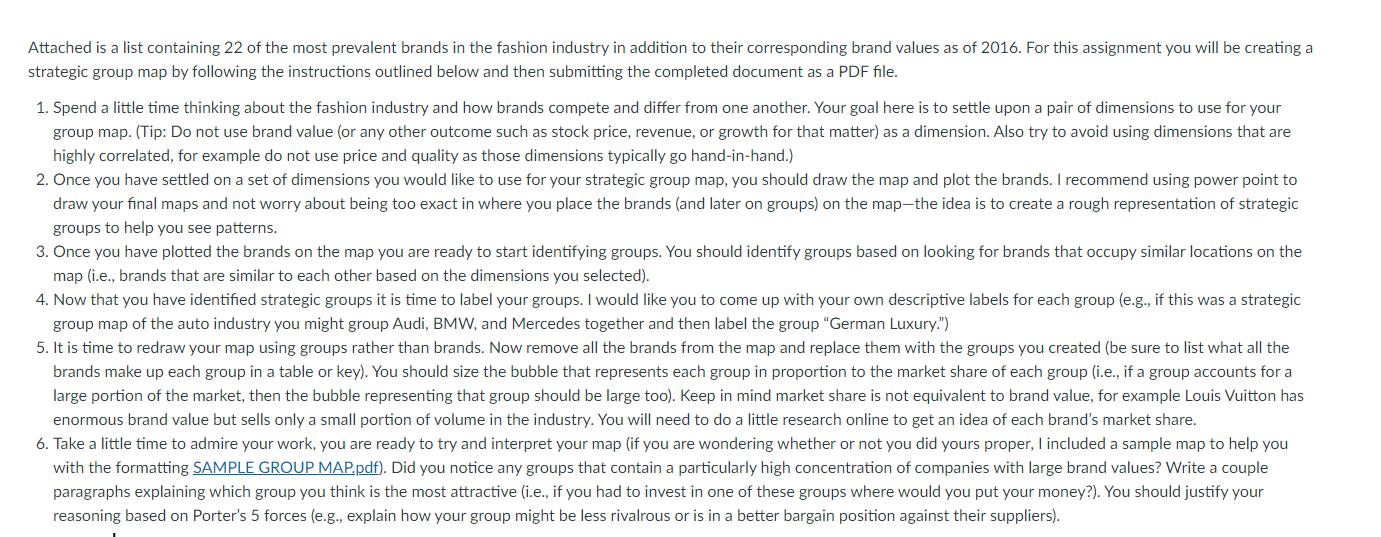
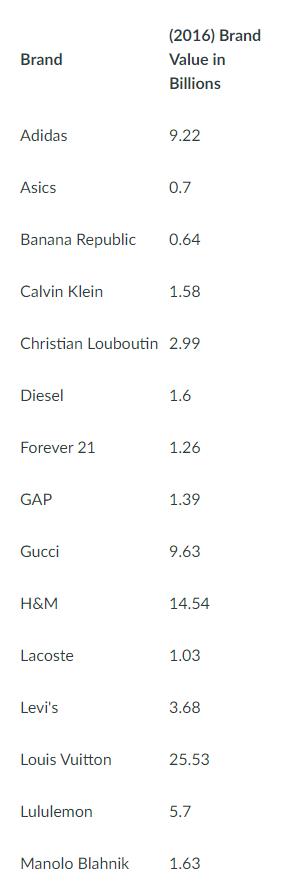
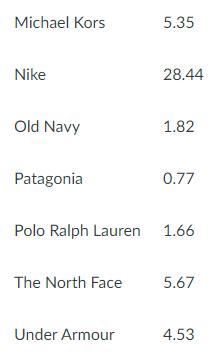
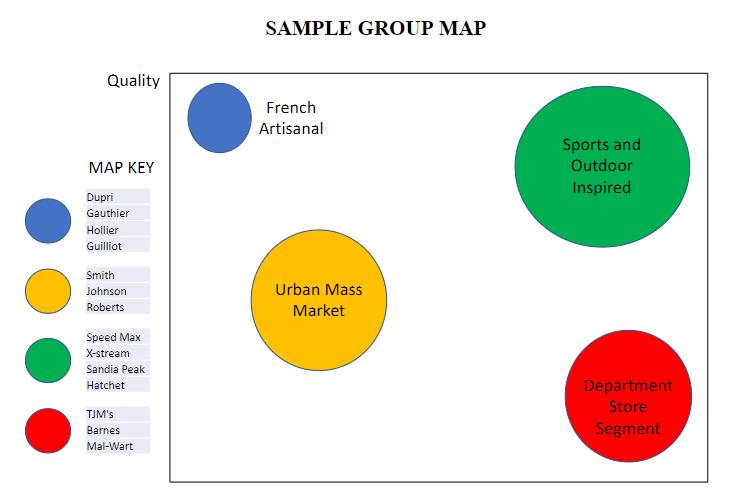
Attached is a list containing 22 of the most prevalent brands in the fashion industry in addition to their corresponding brand values as of 2016. For this assignment you will be creating a strategic group map by following the instructions outlined below and then submitting the completed document as a PDF file. 1. Spend a little time thinking about the fashion industry and how brands compete and differ from one another. Your goal here is to settle upon a pair of dimensions to use for your group map. (Tip: Do not use brand value (or any other outcome such as stock price, revenue, or growth for that matter) as a dimension. Also try to avoid using dimensions that are highly correlated, for example do not use price and quality as those dimensions typically go hand-in-hand.) 2. Once you have settled on a set of dimensions you would like to use for your strategic group map, you should draw the map and plot the brands. I recommend using power point to draw your final maps and not worry about being too exact in where you place the brands (and later on groups) on the map-the idea is to create a rough representation of strategic groups to help you see patterns. 3. Once you have plotted the brands on the map you are ready to start identifying groups. You should identify groups based on looking for brands that occupy similar locations on the map (i.e., brands that are similar to each other based on the dimensions you selected). 4. Now that you have identified strategic groups it is time to label your groups. I would like you to come up with your own descriptive labels for each group (e.g., if this was a strategic group map of the auto industry you might group Audi, BMW, and Mercedes together and then label the group "German Luxury.") 5. It is time to redraw your map using groups rather than brands. Now remove all the brands from the map and replace them with the groups you created (be sure to list what all the brands make up each group in a table or key). You should size the bubble that represents each group in proportion to the market share of each group (i.e., if a group accounts for a large portion of the market, then the bubble representing that group should be large too). Keep in mind market share is not equivalent to brand value, for example Louis Vuitton has enormous brand value but sells only a small portion of volume in the industry. You will need to do a little research online to get an idea of each brand's market share. 6. Take a little time to admire your work, you are ready to try and interpret your map (if you are wondering whether or not you did yours proper, I included a sample map to help you with the formatting SAMPLE GROUP MAP.pdf). Did you notice any groups that contain a particularly high concentration of companies with large brand values? Write a couple paragraphs explaining which group you think is the most attractive (i.e., if you had to invest in one of these groups where would you put your money?). You should justify your reasoning based on Porter's 5 forces (e.g., explain how your group might be less rivalrous or is in a better bargain position against their suppliers). Brand Adidas Asics Banana Republic Calvin Klein Diesel Forever 21 GAP Gucci Christian Louboutin 2.99 H&M Lacoste Levi's Louis Vuitton Lululemon (2016) Brand Value in Billions Manolo Blahnik 9.22 0.7 0.64 1.58 1.6 1.26 1.39 9.63 14.54 1.03 3.68 25.53 5.7 1.63 Michael Kors Nike Old Navy Patagonia The North Face 5.35 Under Armour 28.44 1.82 Polo Ralph Lauren 1.66 0.77 5.67 4.53 Quality MAP KEY Dupri Gauthier Hollier Guilliot Smith Johnson Roberts Speed Max X-stream Sandia Peak Hatchet TJM's Barnes Mal-Wart SAMPLE GROUP MAP French Artisanal Urban Mass Market Sports and Outdoor Inspired Department Store Segment Attached is a list containing 22 of the most prevalent brands in the fashion industry in addition to their corresponding brand values as of 2016. For this assignment you will be creating a strategic group map by following the instructions outlined below and then submitting the completed document as a PDF file. 1. Spend a little time thinking about the fashion industry and how brands compete and differ from one another. Your goal here is to settle upon a pair of dimensions to use for your group map. (Tip: Do not use brand value (or any other outcome such as stock price, revenue, or growth for that matter) as a dimension. Also try to avoid using dimensions that are highly correlated, for example do not use price and quality as those dimensions typically go hand-in-hand.) 2. Once you have settled on a set of dimensions you would like to use for your strategic group map, you should draw the map and plot the brands. I recommend using power point to draw your final maps and not worry about being too exact in where you place the brands (and later on groups) on the map-the idea is to create a rough representation of strategic groups to help you see patterns. 3. Once you have plotted the brands on the map you are ready to start identifying groups. You should identify groups based on looking for brands that occupy similar locations on the map (i.e., brands that are similar to each other based on the dimensions you selected). 4. Now that you have identified strategic groups it is time to label your groups. I would like you to come up with your own descriptive labels for each group (e.g., if this was a strategic group map of the auto industry you might group Audi, BMW, and Mercedes together and then label the group "German Luxury.") 5. It is time to redraw your map using groups rather than brands. Now remove all the brands from the map and replace them with the groups you created (be sure to list what all the brands make up each group in a table or key). You should size the bubble that represents each group in proportion to the market share of each group (i.e., if a group accounts for a large portion of the market, then the bubble representing that group should be large too). Keep in mind market share is not equivalent to brand value, for example Louis Vuitton has enormous brand value but sells only a small portion of volume in the industry. You will need to do a little research online to get an idea of each brand's market share. 6. Take a little time to admire your work, you are ready to try and interpret your map (if you are wondering whether or not you did yours proper, I included a sample map to help you with the formatting SAMPLE GROUP MAP.pdf). Did you notice any groups that contain a particularly high concentration of companies with large brand values? Write a couple paragraphs explaining which group you think is the most attractive (i.e., if you had to invest in one of these groups where would you put your money?). You should justify your reasoning based on Porter's 5 forces (e.g., explain how your group might be less rivalrous or is in a better bargain position against their suppliers). Brand Adidas Asics Banana Republic Calvin Klein Diesel Forever 21 GAP Gucci Christian Louboutin 2.99 H&M Lacoste Levi's Louis Vuitton Lululemon (2016) Brand Value in Billions Manolo Blahnik 9.22 0.7 0.64 1.58 1.6 1.26 1.39 9.63 14.54 1.03 3.68 25.53 5.7 1.63 Michael Kors Nike Old Navy Patagonia The North Face 5.35 Under Armour 28.44 1.82 Polo Ralph Lauren 1.66 0.77 5.67 4.53 Quality MAP KEY Dupri Gauthier Hollier Guilliot Smith Johnson Roberts Speed Max X-stream Sandia Peak Hatchet TJM's Barnes Mal-Wart SAMPLE GROUP MAP French Artisanal Urban Mass Market Sports and Outdoor Inspired Department Store Segment
Expert Answer:

Related Book For 
Management Accounting
ISBN: 9780730369387
4th Edition
Authors: Leslie G. Eldenburg, Albie Brooks, Judy Oliver, Gillian Vesty, Rodney Dormer, Vijaya Murthy, Nick Pawsey
Posted Date:
Students also viewed these general management questions
-
Planning is one of the most important management functions in any business. A front office managers first step in planning should involve determine the departments goals. Planning also includes...
-
List three specific parts of the Case Guide, Objectives and Strategy Section (See below) that you had the most difficulty understanding. Describe your current understanding of these parts. Provide...
-
This assignment reviews object-oriented programming concepts such as classes, methods, constructors, accessor methods, and access modifiers. It makes use of an array of objects as a class data...
-
On January 2, 2016, Allen Company purchased a machine for $70,000. This machine has a five-year useful life, a residual value of $10,000, and it is depreciated using the straight-line method for...
-
The environmentally safe refrigerant R-142b (see Problem 13.45) is to be evaluated as the working fluid in a portable, closed-cycle power plant. The air-cooled condenser temperature is fixed at...
-
Repeat Prob. 527 using maximum shear stress
-
What are opportunity costs? Why are they important to managers? What is the opportunity cost of not investing in environmental protection? Provide an example to support your answer.
-
Use the data in the following table to a. Prepare a frequency distribution of the respondents ages b. Cross-tabulate the respondents genders with cola preference c. Identify anyoutliers Weekly Unit...
-
1. Jos Lpez has $ 15,000 in a 6-year certificate of deposit (CD) that pays a guaranteed annual rate of 4%. Make a timeline showing when the cash flows will occur. 2. Oliver Lpez deposits $ 12,000 in...
-
The Case Study - "Lemonade: Delighting Insurance Customers with AI and Behavioral Economics". 1. How do you explain the phenomenal growth experienced by Lemonade? 2. Does Lemonade create a unique...
-
If we assume that the best line representing the coordinate pairs of points resulting from an experiment is: Y=mX+b, and the deviations of the experimental points with respect to that line are: Y i...
-
https://phet.colorado.edu/sims/html/collision-lab/latest/collision-lab_en.html Part (2): m1 m2 1) KEEP: Elasticity at 100% 2) Select: m 1 = 3 kg and m 2 = 1.5 kg 3) Position 1 (-1.00m) and position 2...
-
Lynch Company owns and operates a delivery van that originally cost $51,500. Lynch has recorded straight-line depreciation on the van for four years, calculated assuming a $5,000 expected salvage...
-
Edwin Smith, L.L.C. V. Synergy Operating L.L.C. There is Nothing Which so Generally Strikes the Imagination, and Engages the Affections of Mankind as the Right of Property.: William Blackstone,...
-
The circuit below shows an ideal battery, four resistors, and three open switches. =3 V, R = 10 Q2, R = 15 Q, R3 = 5 Q, and R4 = 2 Q. a. With all three switches closed, what is the current through...
-
On its December 31, 2024 balance sheet, Crane Company appropriately reported a $10,000 debit balance in its Fair Value Adjustment account. There was no change during 2025 in the composition of...
-
In Philippine Civil Law, if today Mr. A obliged himself to give to B his only horse or his only cow on June 12, 2023 on the other hand the twin brother W today obliged himself to give to Y his only...
-
The value of a share of common stock depends on the cash flows it is expected to provide, and those flows consist of the dividends the investor receives each year while holding the stock and the...
-
Sarah Tesar is the lead partner of a medium-sized accounting firm. The eight partners share in an annual bonus pool. The characteristics of the bonus pool system include: The bonus pool size each...
-
SmallScale Publishing has just commenced business and will sell only one title, New to Business. Market analysis has indicated that sales for the next 6 months should be 5 000 copies. The accountant...
-
The Enviro division of Solar Sun produces solar panels, 20 per cent of which are sold to the Energy Plus division of Solar Sun and the remainder to outside customers. Solar Sun treats its divisions...
-
The bent plate has a mass of \(70 \mathrm{~kg}\) per square meter of surface area and revolves about the \(z\)-axis at the rate \(\omega=30 \mathrm{rad} / \mathrm{s}\). Determine (a) the angular...
-
The two circular disks, each of mass \(m_{1}\), are connected by the curved bar bent into quarter-circular arcs and welded to the disks. The bar has a mass \(m_{2}\). The total mass of the assembly...
-
The turbine rotor in a ship's power plant has a mass of \(1000 \mathrm{~kg}\), with center of mass at \(G\) and a radius of gyration of \(200 \mathrm{~mm}\). The rotor shaft is mounted in bearings...

Study smarter with the SolutionInn App