

Question: Attached is the case 3 pages. Then my spreadsheet (which is not correct, feed back at the bottom). Then a picture of the text I
Attached is the case 3 pages. Then my spreadsheet (which is not correct, feed back at the bottom). Then a picture of the text I was told to refer to. I need the spreadsheet to be correct to write my paper but I can't get the numbers right.
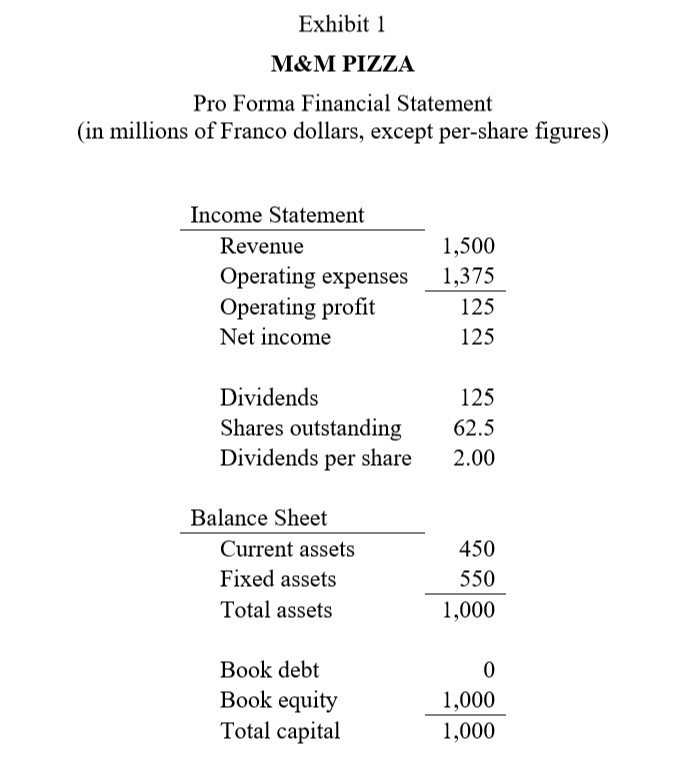
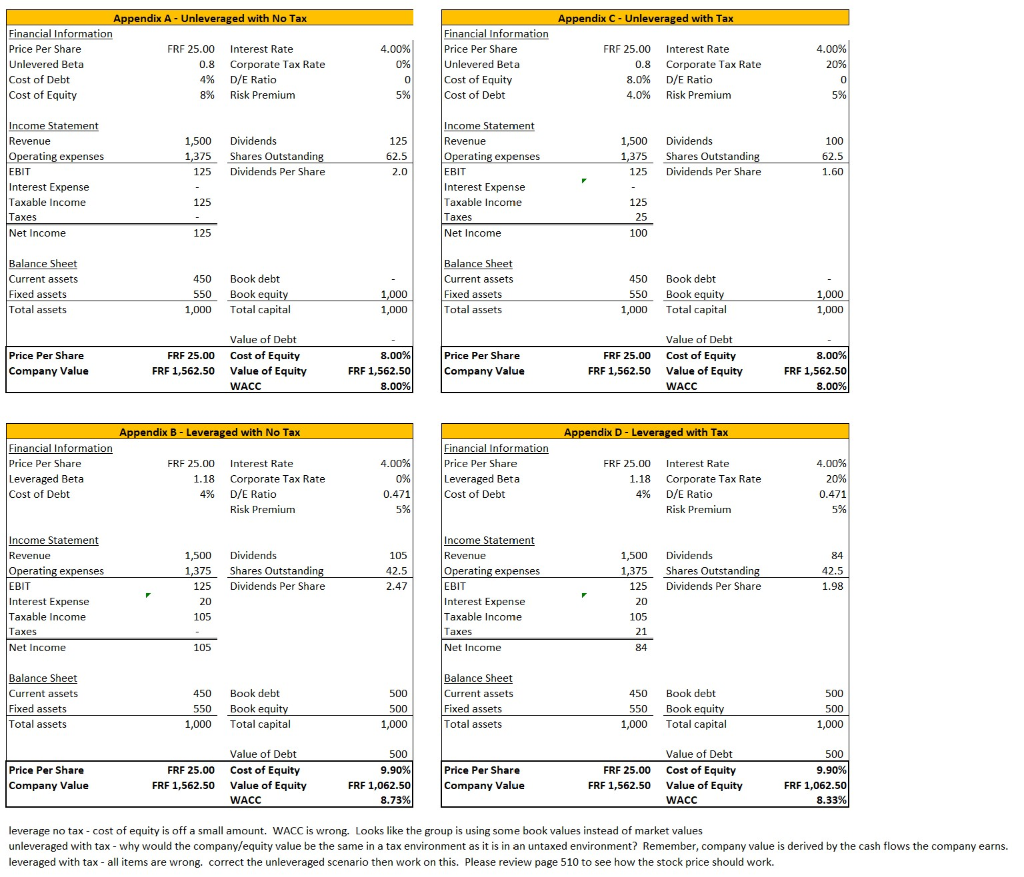
M&M PIZZA Twenty-nine-year-old Moe Miller had recently been appointed managing director at M&M Pizza, a premium pizza producer in the small country of Francostan. As a third-generation director of M&M Pizza, Miller was anxious to make his mark on the company with which he had grown up. The business was operating well, with full penetration of the Francostani market, but Miller felt that the financial policies of the company were overly conservative. Despite generating strong and steady profitability of about F$125 million per year over recent memory, M&M Pizza's stock price had been flat for years, at about F$25 per share. His new office, Miller discovered, had an unobstructed view of the nearby marble quarry. How wonderfully irrelevant, he thought to himself as he turned to the financial analysis on his desk. With borrowing costs running at only 4%, he felt confident that recapitalizing the balance sheet would create sustained value for M&M owners. His plan called for issuing F$500 million in new company debt and using the proceeds to repurchase F$500 million in company shares. The plan would leave assets, profits, and operations of the business unchanged but allow M&M w at the relatively low prevailing market yields on debt and increase dividends per share. Committed to raising the share price, Miller felt it was time to slice up the company's capital structure a little differently. Francostan The Mediterranean island nation of Francostan had a long tradition of political and economic stability. The country had been under the benevolent rule of a single family for generations. The national economy maintained few ties with neighboring countries, and trade was almost nonexistent. The population was stable, with approximately 12 million prosperous, well-educated inhabitants. The country was known for its exceptional IT and regulation infrastructure; citizens had unrivaled access to business and economic information. Economic policies in the country supported stability. Price inflation for the national currency, the Franco 1 F$ = Franco dollars. dollar, had been near zero for some time and was expected to remain so for the foreseeable future. Short- and long-term interest rates for government and business debt were steady at 4%. Occasionally, the economy experienced short periods of economic expansion and contraction. The country's population was known for its high ethical standards. Business promises and financial obligations were considered fully binding. To support the country's practices, the government maintained no bankruptcy law, and all contractual obligations were fully and completely enforced. To encourage economic development, the government did not tax business income. Instead, government tax revenue was levied through personal income taxes. There was a law under consideration to alter the tax policy by introducing a 20% corporate income tax. To maintain business investment incentives under the plan, interest payments would be tax deductible. The Recapitalization Decision Miller's proposed recapitalization involved raising F$500 million in cash by issuing new debt at the prevailing 4% borrowing rate and using the cash to repurchase company shares.2 Miller was confident that shareholders would be better off. Not only would they receive F$500 million in cash, but Miller expected that the share price would rise. M&M maintained a dividend policy of returning all company profits to equity holders in the form of dividends. Although total dividends would decline under the new plan, Miller anticipated that the reduction in the number of shares would allow for a net increase in the dividends paid per remaining share outstanding. With a desire to set the tone of his leadership at M&M, Miller wanted to implement the initiative immediately. The accounting office had provided a set of pro forma M&M financial statements for the coming year (Exhibit 1). Based on a rudimentary knowledge of corporate finance, Miller estimated the current cost of equity (and WACC) for M&M with the current no-debt policy at 8% based on a market risk premium of 5% and a company beta of 0.8. Miller appreciated that, because equity holders bore the business risk, they deserved to receive a higher return. Nonetheless, from a simple comparison of the 8% cost of equity with the 4% cost of debt, equity appeared to be an expensive source of funds. To Miller, substituting debt for equity was a superior financial policy because it gave the company cheaper capital. With other business inputs, the company was aggressive in sourcing quality materials and labor at the lowest available cost. Shouldn't M&M do the same for its capital? 2 The recapitalization would change the number of shares outstanding for M&M from 62.5 million to 42.5 million. 3 Miller's uncle, Mert, was highly skeptical of Miller's proposal. Uncle Mert claimed that substituting debt for equity capital shifted more business risk of the firm to equity holders, so they required higher returns. He countered that M&M's beta of 0.8 must increase in the following manner: Levered beta = (Unlevered beta) X [1 + (1 t) D/E], where t is the corporate tax rate, D is the debt value, and E is the equity value. With the F$500 million share-repurchase proposal, Uncle Mert asserted that M&M's D/E ratio would become 0.471. Exhibit 1 M&M PIZZA Pro Forma Financial Statement (in millions of Franco dollars, except per-share figures) Income Statement Revenue Operating expenses Operating profit Net income 1,500 1,375 125 125 Dividends Shares outstanding Dividends per share 125 62.5 2.00 Balance Sheet Current assets Fixed assets Total assets 450 550 1,000 Book debt Book equity Total capital 1,000 1,000 Appendix C - Unleveraged with Tax 4.00% 4.00% Appendix A - Unleveraged with No Tax Financial Information Price Per Share FRF 25.00 Interest Rate Unlevered Beta 0.8 Corporate Tax Rate Cost of Debt 4% D/E Ratio Cost of Equity 8% Risk Premium Financial Information Price Per Share Unlevered Beta Cost of Equity Cost of Debt FRF 25.00 0.8 8.0% 4.0% Interest Rate Corporate Tax Rate D/E Ratio Risk Premium 5% 1,500 1,375 125 Dividends Shares Outstanding Dividends Per Share 62.5 2.0 1,500 1,375 125 Dividends Shares Outstanding Dividends Per Share 62.5 1.60 Income Statement Revenue Operating expenses EBIT Interest Expense Taxable income Taxes Net Income Income Statement Revenue Operating expenses EBIT Interest Expense Taxable income Taxes Net Income 125 125 100 Balance Sheet Current assets Fixed assets Total assets 450 550 1,000 Book debt Book equity Total capital Balance Sheet Current assets Fixed assets Total assets 1,000 450 550 1,000 Book debt Book equity Total capital 1,000 1.000 1,000 Price Per Share Company Value FRF 25.00 FRF 1,562.50 Value of Debt Cost of Equity Value of Equity WACC 8.00% FRF 1,562.50 8.00% Price Per Share Company Value FRF 25.00 FRF 1,562.50 Value of Debt Cost of Equity Value of Equity WACC 8.00% FRF 1,562.50 8.00% Appendix B - Leveraged with No Tax Appendix D - Leveraged with Tax Financial Information Price Per Share Leveraged Beta Cost of Debt FRF 25.00 1.18 4% Interest Rate Corporate Tax Rate D/E Ratio Risk Premium 4.00% 0% 0.471 5% Financial Information Price Per Share Leveraged Beta Cost of Debt FRF 25.00 1.18 4% Interest Rate Corporate Tax Rate D/E Ratio Risk Premium 4.00% 20% 0.471 Dividends Shares Outstanding Dividends Per Share 105 42.5 1,500 1,375 125 20 105 1,500 1,375 125 Dividends Shares Outstanding Dividends Per Share Income Statement Revenue Operating expenses EBIT Interest Expense Taxable income Taxes Net Income 2.47 Income Statement Revenue Operating expenses EBIT Interest Expense Taxable income Taxes Net Income 20 105 105 84 Balance Sheet Current assets Fixed assets Total assets 450 550 1,000 Book debt Book equity Total capital 500 500 1,000 Balance Sheet Current assets Fixed assets Total assets 450 550 1,000 Book debt Book equity Total capital 1,000 Price Per Share Company Value FRF 25.00 FRF 1,562.50 Value of Debt Cost of Equity Value of Equity WACC 500 9.90% FRF 1,062.50 8.73% Price Per Share Company Value FRF 25.00 FRF 1,562.50 Value of Debt Cost of Equity Value of Equity WACC 500 9.90% FRF 1,062.50 8.33% leverage no tax-cost of equity is off a small amount. WACC is wrong. Looks like the group is using some book values instead of market values unleveraged with tax-why would the company/equity value be the same in a tax environment as it is in an untaxed environment? Remember, company value is derived by the cash flows the company earns. leveraged with tax - all items are wrong. correct the unleveraged scenario then work on this. Please review page 510 to see how the stock price should work. THE WEIGHTED AVERAGE COST OF CAPITAL, WACC, AND CORPORATE TAXES In L Chapter 13, we defined the weighted average cost of capital (with corporate taxes) as follows (note that VL = S+ B ): WACC = SVLRS+BVLRB (1-TC) Note that the cost of debt capital, RB, is multiplied by ( 1-TC) because interest is tax deductible at the corporate level. However, the cost of equity, RS, is not multiplied by this factor because dividends are not deductible. In the no-tax case, WACC is unaffected by leverage. This result is reflected in Figure 16.3, which we discussed earlier. However, because debt is tax-advantaged relative to equity, it can be shown that WACC declines with leverage in a world with corporate taxes. This result can be seen in Figure 16.6. For Divided Airlines, WACC is equal to: WACC - ($ 342 $ 542 ) *.2462 ($ 200 $ 542 ) *.10 x .79 - 1845. or 18.45% Divided Airlines has reduced its WACC from 20 percent (with no debt) to 18.45 percent with reliance on debt. This result is intuitively pleasing because it suggests that when a firm lowers its WACC, the firm's value will increase. Using the WACC approach, we can confirm that the value of Divided Airlines is $542: VL = EBIT (1-TC) WACC = $ 100.1845 = $ 542 Page 510 M&M PIZZA Twenty-nine-year-old Moe Miller had recently been appointed managing director at M&M Pizza, a premium pizza producer in the small country of Francostan. As a third-generation director of M&M Pizza, Miller was anxious to make his mark on the company with which he had grown up. The business was operating well, with full penetration of the Francostani market, but Miller felt that the financial policies of the company were overly conservative. Despite generating strong and steady profitability of about F$125 million per year over recent memory, M&M Pizza's stock price had been flat for years, at about F$25 per share. His new office, Miller discovered, had an unobstructed view of the nearby marble quarry. How wonderfully irrelevant, he thought to himself as he turned to the financial analysis on his desk. With borrowing costs running at only 4%, he felt confident that recapitalizing the balance sheet would create sustained value for M&M owners. His plan called for issuing F$500 million in new company debt and using the proceeds to repurchase F$500 million in company shares. The plan would leave assets, profits, and operations of the business unchanged but allow M&M w at the relatively low prevailing market yields on debt and increase dividends per share. Committed to raising the share price, Miller felt it was time to slice up the company's capital structure a little differently. Francostan The Mediterranean island nation of Francostan had a long tradition of political and economic stability. The country had been under the benevolent rule of a single family for generations. The national economy maintained few ties with neighboring countries, and trade was almost nonexistent. The population was stable, with approximately 12 million prosperous, well-educated inhabitants. The country was known for its exceptional IT and regulation infrastructure; citizens had unrivaled access to business and economic information. Economic policies in the country supported stability. Price inflation for the national currency, the Franco 1 F$ = Franco dollars. dollar, had been near zero for some time and was expected to remain so for the foreseeable future. Short- and long-term interest rates for government and business debt were steady at 4%. Occasionally, the economy experienced short periods of economic expansion and contraction. The country's population was known for its high ethical standards. Business promises and financial obligations were considered fully binding. To support the country's practices, the government maintained no bankruptcy law, and all contractual obligations were fully and completely enforced. To encourage economic development, the government did not tax business income. Instead, government tax revenue was levied through personal income taxes. There was a law under consideration to alter the tax policy by introducing a 20% corporate income tax. To maintain business investment incentives under the plan, interest payments would be tax deductible. The Recapitalization Decision Miller's proposed recapitalization involved raising F$500 million in cash by issuing new debt at the prevailing 4% borrowing rate and using the cash to repurchase company shares.2 Miller was confident that shareholders would be better off. Not only would they receive F$500 million in cash, but Miller expected that the share price would rise. M&M maintained a dividend policy of returning all company profits to equity holders in the form of dividends. Although total dividends would decline under the new plan, Miller anticipated that the reduction in the number of shares would allow for a net increase in the dividends paid per remaining share outstanding. With a desire to set the tone of his leadership at M&M, Miller wanted to implement the initiative immediately. The accounting office had provided a set of pro forma M&M financial statements for the coming year (Exhibit 1). Based on a rudimentary knowledge of corporate finance, Miller estimated the current cost of equity (and WACC) for M&M with the current no-debt policy at 8% based on a market risk premium of 5% and a company beta of 0.8. Miller appreciated that, because equity holders bore the business risk, they deserved to receive a higher return. Nonetheless, from a simple comparison of the 8% cost of equity with the 4% cost of debt, equity appeared to be an expensive source of funds. To Miller, substituting debt for equity was a superior financial policy because it gave the company cheaper capital. With other business inputs, the company was aggressive in sourcing quality materials and labor at the lowest available cost. Shouldn't M&M do the same for its capital? 2 The recapitalization would change the number of shares outstanding for M&M from 62.5 million to 42.5 million. 3 Miller's uncle, Mert, was highly skeptical of Miller's proposal. Uncle Mert claimed that substituting debt for equity capital shifted more business risk of the firm to equity holders, so they required higher returns. He countered that M&M's beta of 0.8 must increase in the following manner: Levered beta = (Unlevered beta) X [1 + (1 t) D/E], where t is the corporate tax rate, D is the debt value, and E is the equity value. With the F$500 million share-repurchase proposal, Uncle Mert asserted that M&M's D/E ratio would become 0.471. Exhibit 1 M&M PIZZA Pro Forma Financial Statement (in millions of Franco dollars, except per-share figures) Income Statement Revenue Operating expenses Operating profit Net income 1,500 1,375 125 125 Dividends Shares outstanding Dividends per share 125 62.5 2.00 Balance Sheet Current assets Fixed assets Total assets 450 550 1,000 Book debt Book equity Total capital 1,000 1,000 Appendix C - Unleveraged with Tax 4.00% 4.00% Appendix A - Unleveraged with No Tax Financial Information Price Per Share FRF 25.00 Interest Rate Unlevered Beta 0.8 Corporate Tax Rate Cost of Debt 4% D/E Ratio Cost of Equity 8% Risk Premium Financial Information Price Per Share Unlevered Beta Cost of Equity Cost of Debt FRF 25.00 0.8 8.0% 4.0% Interest Rate Corporate Tax Rate D/E Ratio Risk Premium 5% 1,500 1,375 125 Dividends Shares Outstanding Dividends Per Share 62.5 2.0 1,500 1,375 125 Dividends Shares Outstanding Dividends Per Share 62.5 1.60 Income Statement Revenue Operating expenses EBIT Interest Expense Taxable income Taxes Net Income Income Statement Revenue Operating expenses EBIT Interest Expense Taxable income Taxes Net Income 125 125 100 Balance Sheet Current assets Fixed assets Total assets 450 550 1,000 Book debt Book equity Total capital Balance Sheet Current assets Fixed assets Total assets 1,000 450 550 1,000 Book debt Book equity Total capital 1,000 1.000 1,000 Price Per Share Company Value FRF 25.00 FRF 1,562.50 Value of Debt Cost of Equity Value of Equity WACC 8.00% FRF 1,562.50 8.00% Price Per Share Company Value FRF 25.00 FRF 1,562.50 Value of Debt Cost of Equity Value of Equity WACC 8.00% FRF 1,562.50 8.00% Appendix B - Leveraged with No Tax Appendix D - Leveraged with Tax Financial Information Price Per Share Leveraged Beta Cost of Debt FRF 25.00 1.18 4% Interest Rate Corporate Tax Rate D/E Ratio Risk Premium 4.00% 0% 0.471 5% Financial Information Price Per Share Leveraged Beta Cost of Debt FRF 25.00 1.18 4% Interest Rate Corporate Tax Rate D/E Ratio Risk Premium 4.00% 20% 0.471 Dividends Shares Outstanding Dividends Per Share 105 42.5 1,500 1,375 125 20 105 1,500 1,375 125 Dividends Shares Outstanding Dividends Per Share Income Statement Revenue Operating expenses EBIT Interest Expense Taxable income Taxes Net Income 2.47 Income Statement Revenue Operating expenses EBIT Interest Expense Taxable income Taxes Net Income 20 105 105 84 Balance Sheet Current assets Fixed assets Total assets 450 550 1,000 Book debt Book equity Total capital 500 500 1,000 Balance Sheet Current assets Fixed assets Total assets 450 550 1,000 Book debt Book equity Total capital 1,000 Price Per Share Company Value FRF 25.00 FRF 1,562.50 Value of Debt Cost of Equity Value of Equity WACC 500 9.90% FRF 1,062.50 8.73% Price Per Share Company Value FRF 25.00 FRF 1,562.50 Value of Debt Cost of Equity Value of Equity WACC 500 9.90% FRF 1,062.50 8.33% leverage no tax-cost of equity is off a small amount. WACC is wrong. Looks like the group is using some book values instead of market values unleveraged with tax-why would the company/equity value be the same in a tax environment as it is in an untaxed environment? Remember, company value is derived by the cash flows the company earns. leveraged with tax - all items are wrong. correct the unleveraged scenario then work on this. Please review page 510 to see how the stock price should work. THE WEIGHTED AVERAGE COST OF CAPITAL, WACC, AND CORPORATE TAXES In L Chapter 13, we defined the weighted average cost of capital (with corporate taxes) as follows (note that VL = S+ B ): WACC = SVLRS+BVLRB (1-TC) Note that the cost of debt capital, RB, is multiplied by ( 1-TC) because interest is tax deductible at the corporate level. However, the cost of equity, RS, is not multiplied by this factor because dividends are not deductible. In the no-tax case, WACC is unaffected by leverage. This result is reflected in Figure 16.3, which we discussed earlier. However, because debt is tax-advantaged relative to equity, it can be shown that WACC declines with leverage in a world with corporate taxes. This result can be seen in Figure 16.6. For Divided Airlines, WACC is equal to: WACC - ($ 342 $ 542 ) *.2462 ($ 200 $ 542 ) *.10 x .79 - 1845. or 18.45% Divided Airlines has reduced its WACC from 20 percent (with no debt) to 18.45 percent with reliance on debt. This result is intuitively pleasing because it suggests that when a firm lowers its WACC, the firm's value will increase. Using the WACC approach, we can confirm that the value of Divided Airlines is $542: VL = EBIT (1-TC) WACC = $ 100.1845 = $ 542 Page 510
Step by Step Solution
There are 3 Steps involved in it

Get step-by-step solutions from verified subject matter experts