

Question: Attached is the question! Please Answer correctly. Its a screenshot! Document-'1 , Word Sign in Insert Draw De Sign in File Home Insert Draw Design
Attached is the question! Please Answer correctly. Its a screenshot!
Document-'1 , Word Sign in Insert Draw De
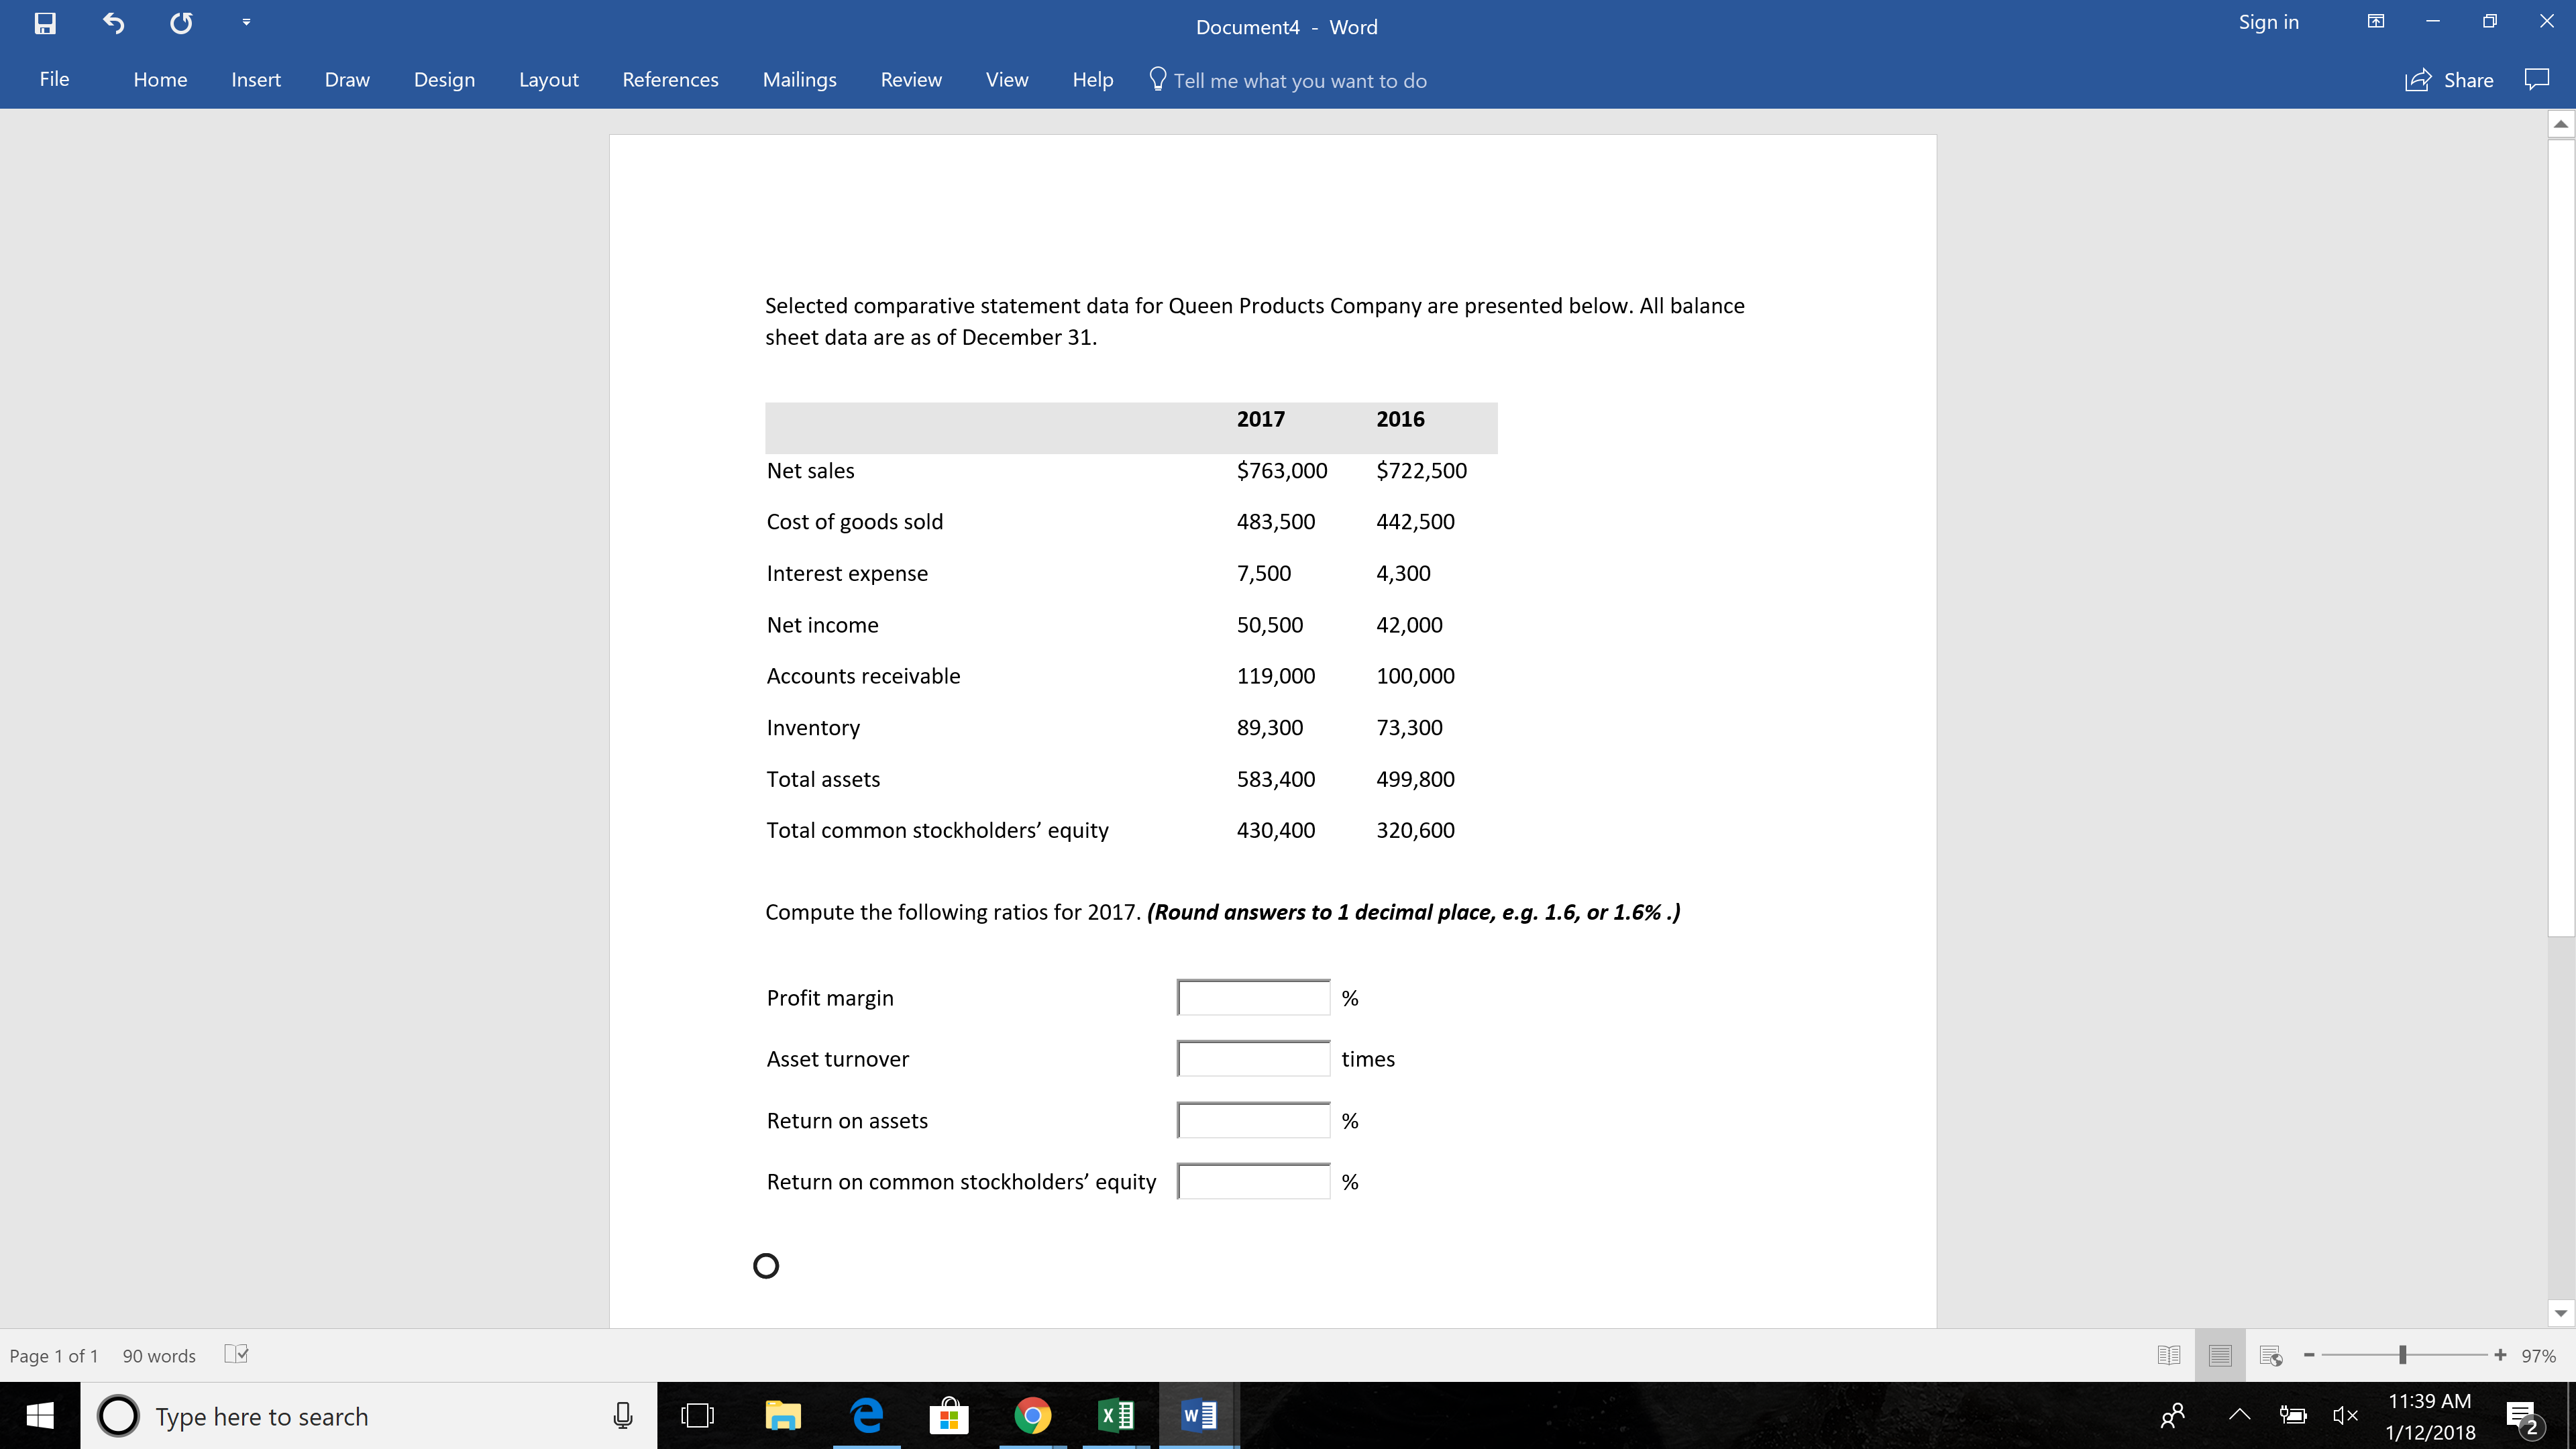
Sign in File Home Insert Draw Design Layout References Mailings Review View Help Document4 - Word Q Tell me what you want to do Selected comparative statement data for Queen Products Company are presented below. All balance sheet data are as of December 31. Net sales Cost of goods sold Interest expense Net income Accounts receivable Inventory Total assets Total common stockholders' equity 2017 $763,000 483,500 7,500 50,500 119,000 89,300 583,400 430,400 2016 $722,500 442,500 42,000 100,000 73,300 499,800 320,600 Compute the following ratios for 2017. (Round answers to 1 decimal place, e.g. 1.6, or 1.6% .) Profit margin Asset turnover Return on assets Return on common stockholders' equity O times Page 1 ofl 90 words o Type here to search L Share 11:39 AM 1/12/2018
Step by Step Solution
There are 3 Steps involved in it

Get step-by-step solutions from verified subject matter experts