

Question: Attached is the task and error bar plot. please address each dot point 54 52 95% CI Length of baby (cm) 50 48 30 years
Attached is the task and error bar plot. please address each dot point
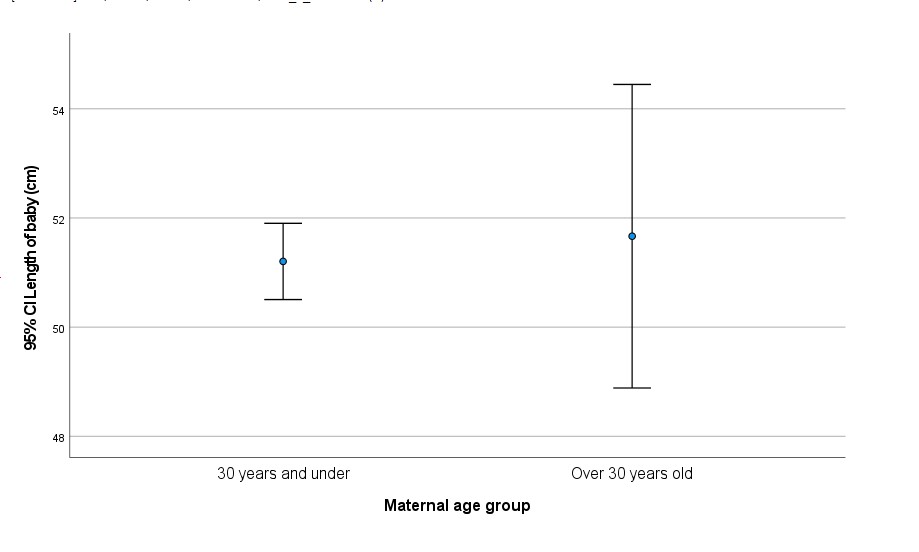
54 52 95% CI Length of baby (cm) 50 48 30 years and under Over 30 years old Maternal age groupTask 2 - Independent t-tests (Visualising the Data) Generate an error bar plot of the confidence intervals of the mean of Length in each category of mage_cat. Ensure this error bar plot is appropriate for your research question. Insert this graph into your assignment submission. Briefly describe (in 1-4 sentences) what this graph shows, with specific mention of: What the middle point of the confidence intervals demonstrates about the groups (i.e. what statistic does this middle point represent? Compare this between the two groups). What the overlap or lack thereof between the intervals suggest about statistical significance (can you use this graph to make an inference or suggestion about statistical significance? Interpret the graph accordingly) . What the difference/similarity in width between the two groups indicates (if the widths are similar, what does that indicate? If they're different, why?) Hint #1: Confidence Level Hint #2: In thinking about the width of the Confidence Interval (CD), what are the key determinants of the width of a CI? There are two
Step by Step Solution
There are 3 Steps involved in it

Get step-by-step solutions from verified subject matter experts