

Question: Attempts: 1 Keep the Highest: 1/3 3. Measuring standalone risk using realized (historical) data Returns earned over a given time period are called realized returns.

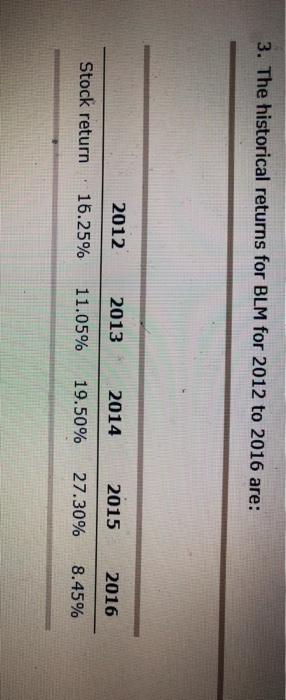
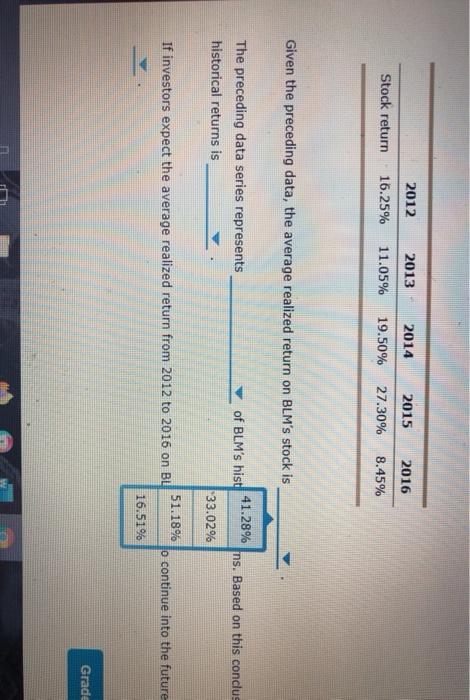
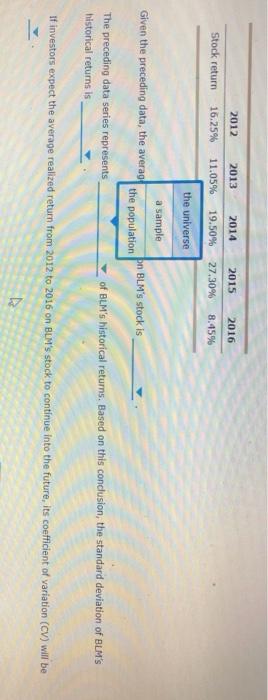
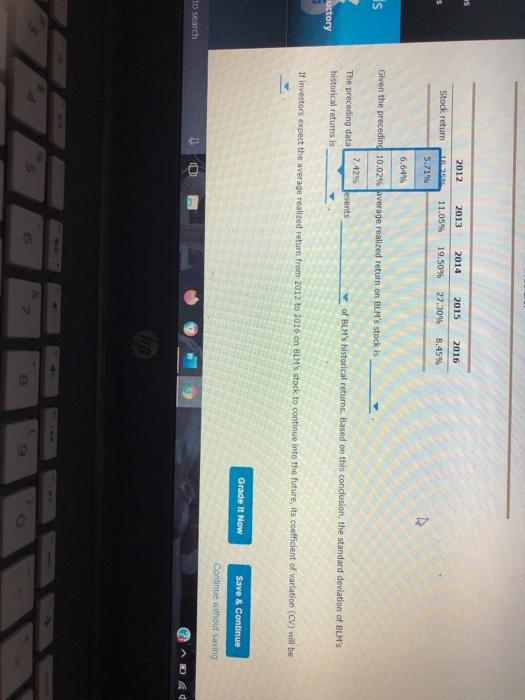
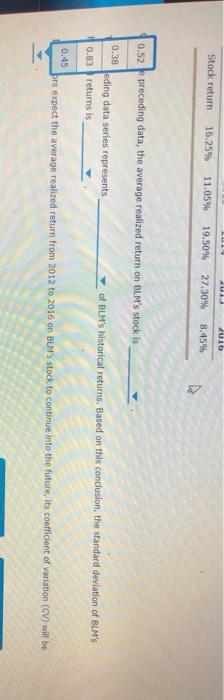
Attempts: 1 Keep the Highest: 1/3 3. Measuring standalone risk using realized (historical) data Returns earned over a given time period are called realized returns. Historical data on realized returns is often used to estimate future results. Analysts across companies use realized stock returns to estimate the risk of a stock. Consider the case of Blue Llama Mining Inc. (BLM): Five years of realized returns for BLM are given in the following table, Remember: 1. While BLM was started 40 years ago, its common stock has been publicly traded for the past 25 years. 2. The returns on its equity are calculated as arithmetic returns. 3. The historical returns for BLM for 2012 to 2016 are: 3. The historical returns for BLM for 2012 to 2016 are: 2012 2013 2014 2015 2016 Stock return 15.25% 11.05% 19.50% 27.30% 8.45% 2012 2013 2014 2015 2016 Stock return 16.25% 11.05% 19.50% 27.30% 8.45% Given the preceding data, the average realized return on BLM's stock is of BLM's hist 41.28% ns. Based on this conclus The preceding data series represents historical returns is 33.02% 51.18% If investors expect the average realized return from 2012 to 2016 on BL o continue into the future 16.51% Grade 2012 2013 2014 2015 2016 Stock return 16.25% 11.05% 19.50% 27,30% 8.45% the universe a sample Given the preceding data, the averag the population bn BLM's stock is The preceding data series represents of BLM's historical returns. Based on this conclusion, the standard deviation of BLM's historical returns is If investors expect the average realized return from 2012 to 2016 on BLM's stock to continue into the future, its coefficient of variation (CV) will be 35 2012 2013 2014 2015 2016 Stock return 11 11.05% 19.50% 27.30% 8.45% 5.71% 6.64% is Given the preceding 10.02% average realized return on BLM's stock is 7.42% Jesents The preceding data historical retums is of BLM's historical returns. Based on this conclusion, the standard deviation of BLM's uctory It investues expect the average realized return from 2012 to 2016 on BL's stock to continue into the future, its coefficient of variation (CV) will be Grade It Now Save & Continue Continue without saving to search 5 2 Zuib Stock return 16.25% 11.05% 19.50% 27.30% 8.45% 0.52 preceding data, the average realized return on BLM's stock is 0.38 eding data series represents 0.83) returns is of BLM's historical returns. Based on this conclusion, the standard deviation of BLM'S 0.45 brs expect the average realized return from 2012 to 2016 on BLM's stock to continue into the future, its coefficient of variation (CV) will be
Step by Step Solution
There are 3 Steps involved in it

Get step-by-step solutions from verified subject matter experts