

Question: Attempts Average 5 11. Changes to the security market line The following graph plots the current security market line (SML) and indicates the return that
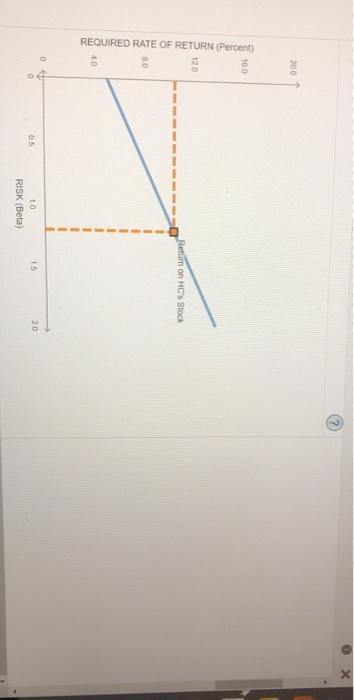
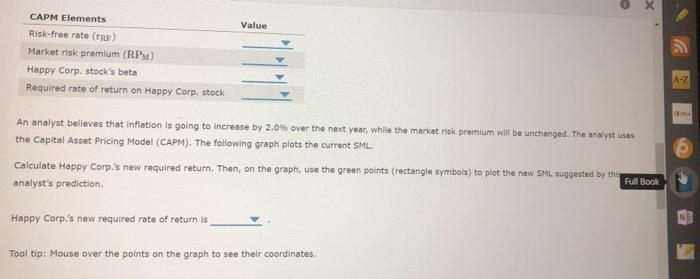
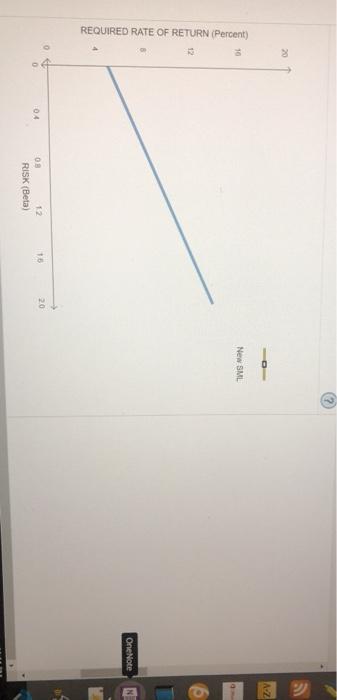
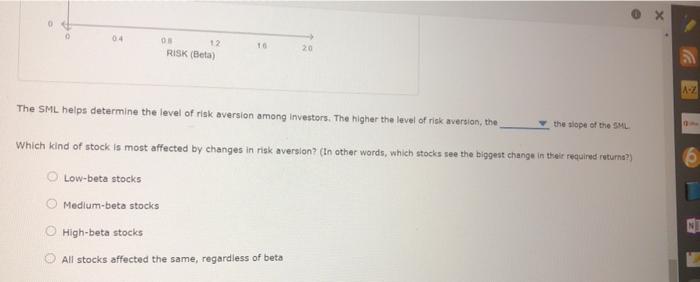
Attempts Average 5 11. Changes to the security market line The following graph plots the current security market line (SML) and indicates the return that investors require from holding stock from Happy Corp, (HC). Based on the graph, complete the table that follows: 20.0 100 EN (Percent 0 x 2001 100 120 Return on HC's Stock REQUIRED RATE OF RETURN (Percent) 30 40 0 20 10 RISK (Beta) x Value CAPM Elements Risk-free rate (TR) Market risk premium (RPM) Happy Corp. stock's beta Required rate of return on Happy Corp. stock A-Z An analyst believes that inflation is going to increase by 2.0% over the next year, while the market risk premium will be unchanged. The analyst uses the Capital Asset Pricing Model (CAPM). The following graph plots the current SML. Calculate Happy Corp's new required return. Then, on the graph, use the green points (rectangle symbols) to plot the new SML suggested by the analyst's prediction Full Book Happy Corp's new required rate of return is Tooltip: Mouse over the points on the graph to see their coordinates (2 10 New SML 12 REQUIRED RATE OF RETURN (Percent) OneNote 10 04 OB RISK (Beta) 04 O 12 RISK (Beta) 20 A The SML helps determine the level of risk aversion among Investors. The higher the level of risk aversion, the the slope of the SML Which kind of stock is most affected by changes in risk version) (In other words, which stocks see the biggest change in their required returne? 1 Low-beta stocks Medium-beta stocks High-beta stocks All stocks affected the same, regardless of beta
Step by Step Solution
There are 3 Steps involved in it

Get step-by-step solutions from verified subject matter experts