

Question: Attempts Keep the Highest / 1 3. Using the midpoint method The following graph gives two points (A and B) along a hypothetical demand curve
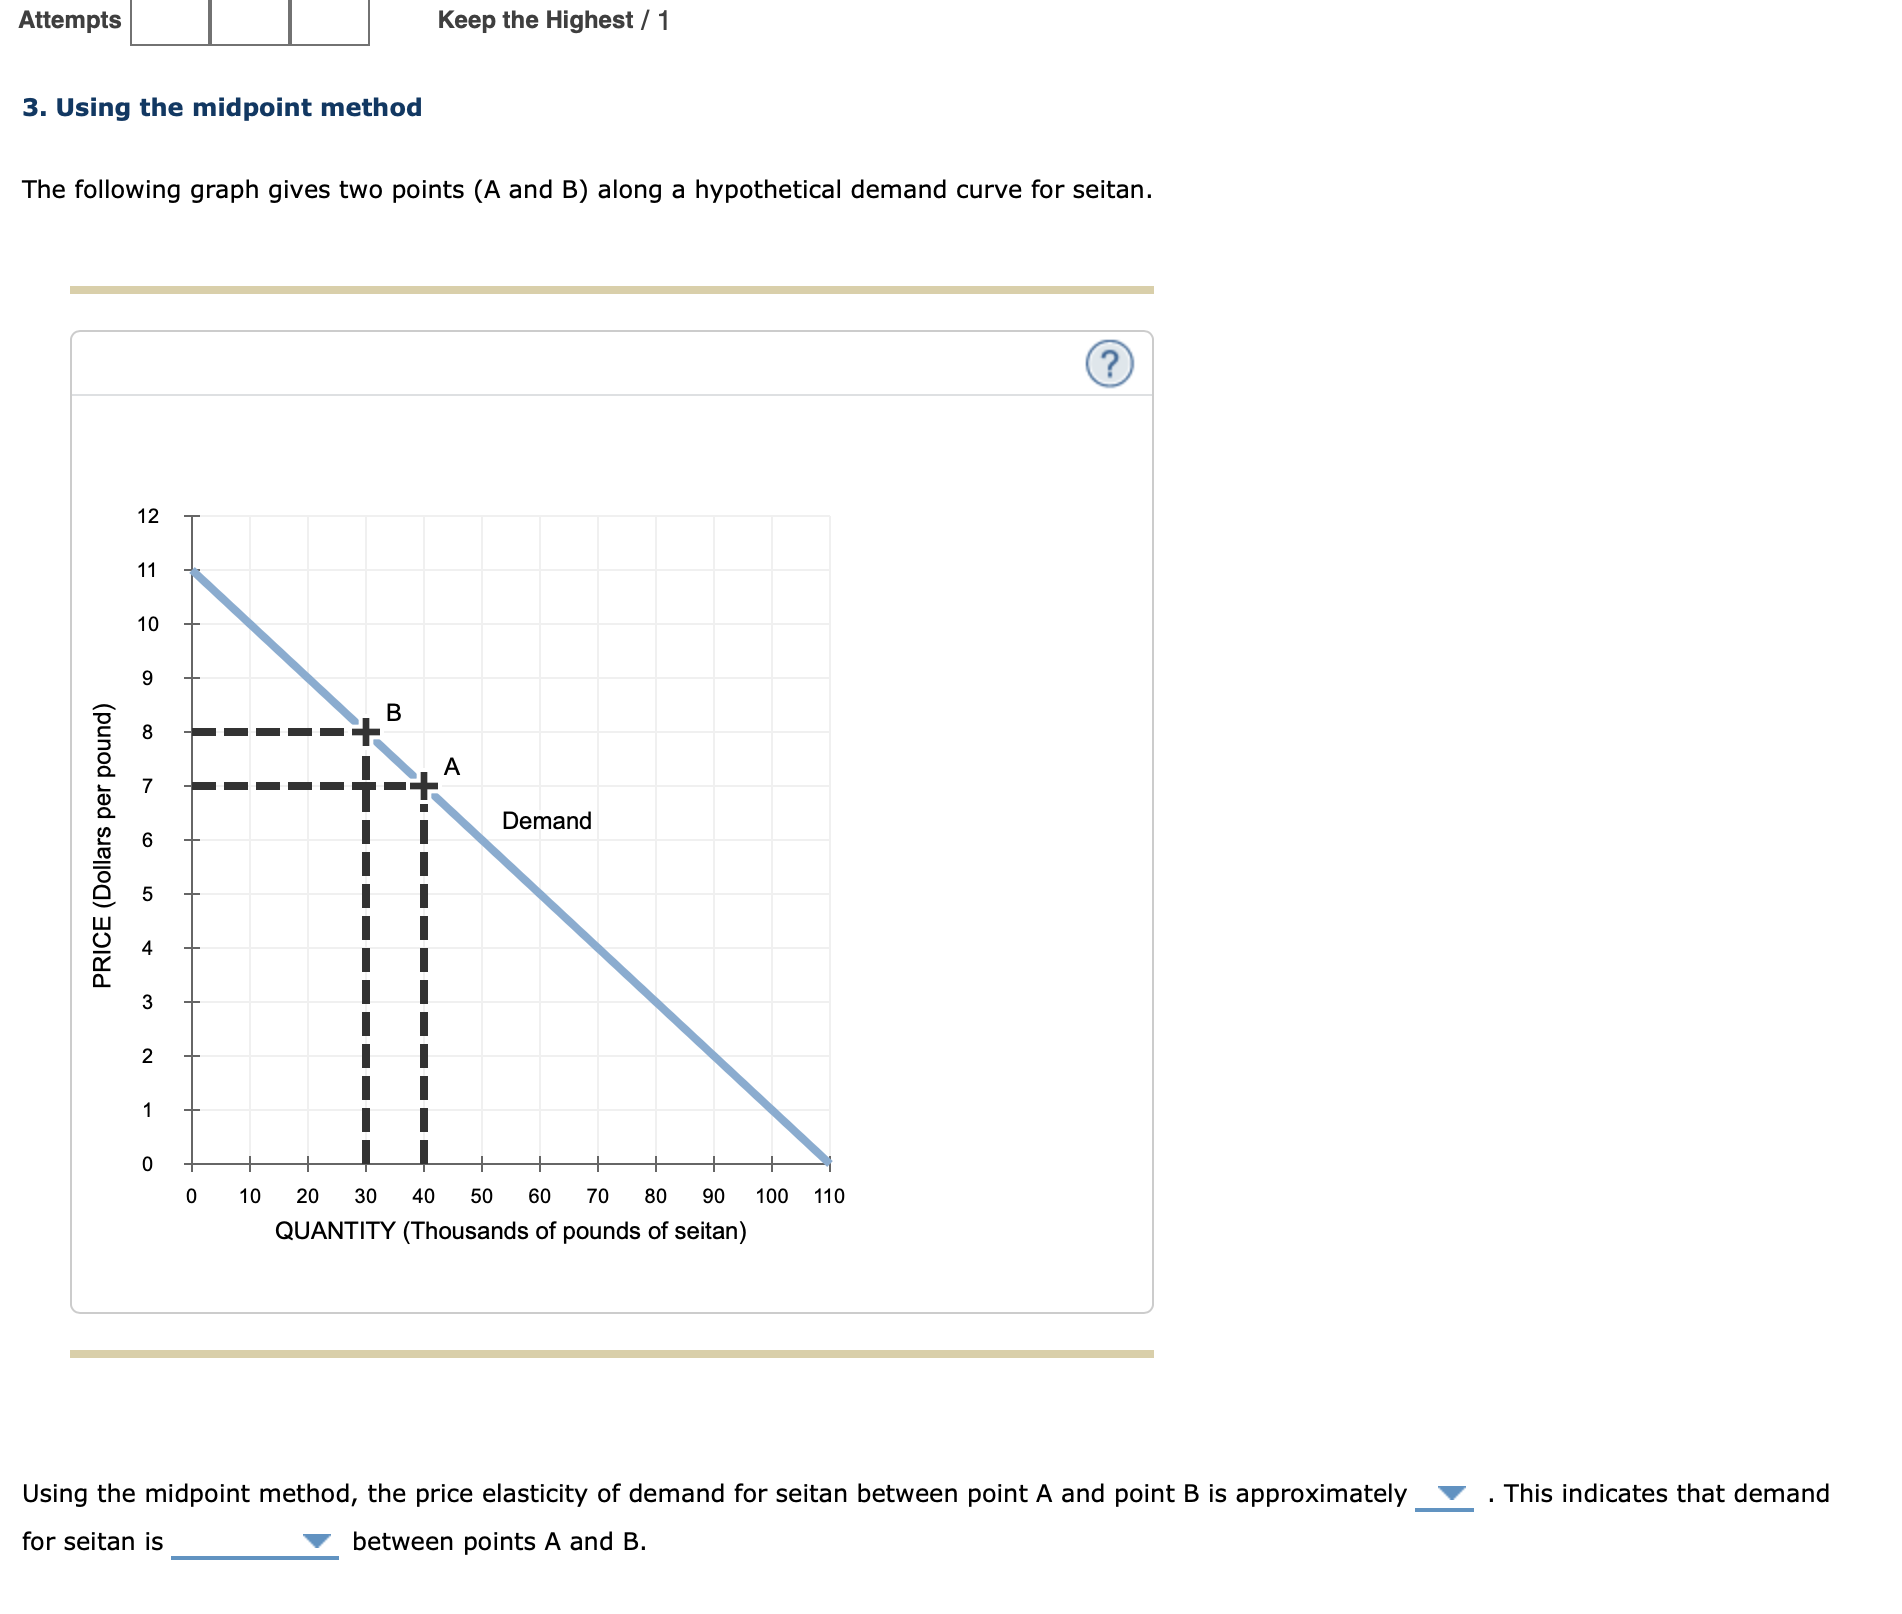
Attempts Keep the Highest / 1 3. Using the midpoint method The following graph gives two points (A and B) along a hypothetical demand curve for seitan. (? 12 10 B A Demand PRICE (Dollars per pound) w N 0 10 20 30 40 50 60 70 80 90 100 110 QUANTITY (Thousands of pounds of seitan) Using the midpoint method, the price elasticity of demand for seitan between point A and point B is approximately _ . . This indicates that demand for seitan is between points A and B
Step by Step Solution
There are 3 Steps involved in it
1 Expert Approved Answer
Step: 1 Unlock

Question Has Been Solved by an Expert!
Get step-by-step solutions from verified subject matter experts
Step: 2 Unlock
Step: 3 Unlock