

Question: Attempts: | Keep the Highest: /20 3. Expected dividends as a basis for stock values The following graph shows the value of a stock's dividends
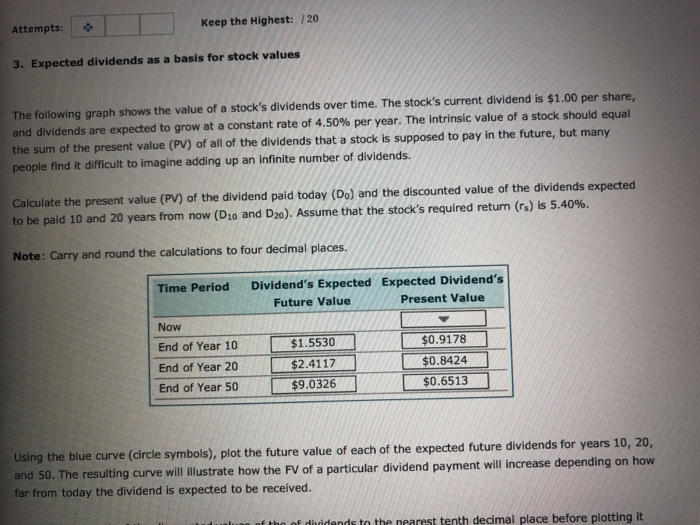
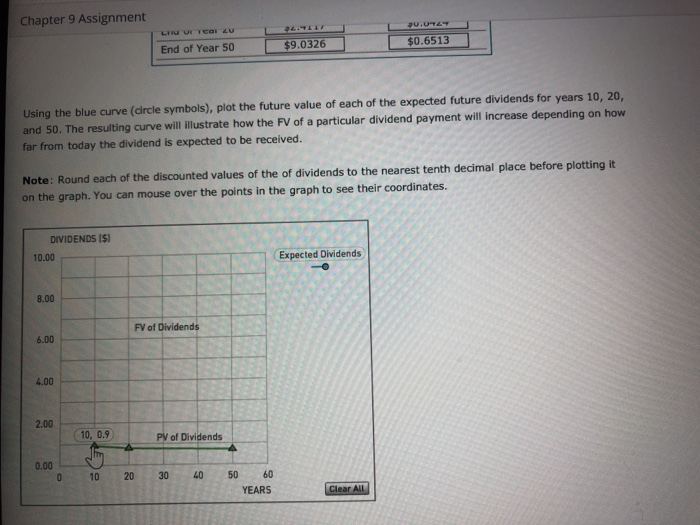
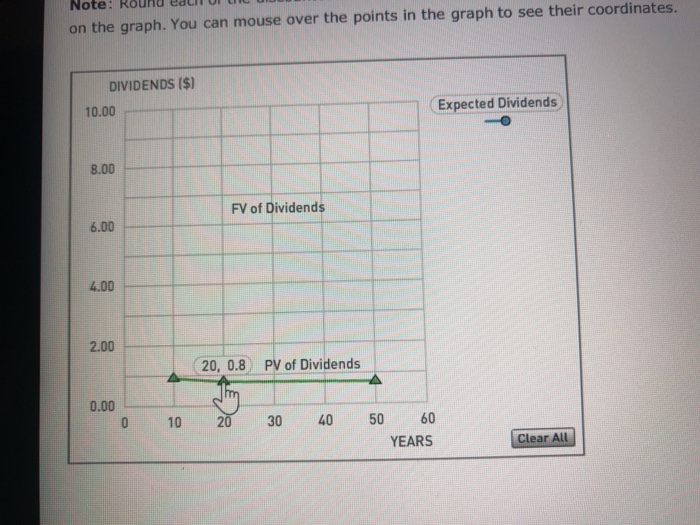
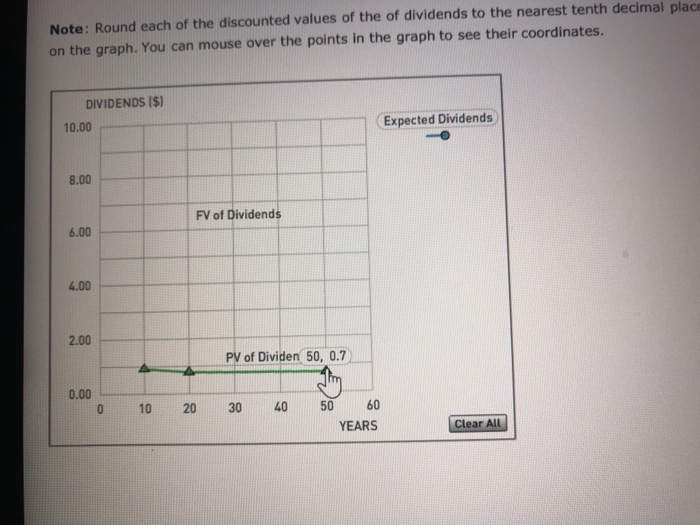
Attempts: | Keep the Highest: /20 3. Expected dividends as a basis for stock values The following graph shows the value of a stock's dividends over time. The stock's current dividend is $1.00 per share, and dividends are expected to grow at a constant rate of 4.50% per year. The intrinsic value of a stock should equal the sum of the present value (PV) of all of the dividends that a stock is supposed to pay in the future, but many people find it difficult to imagine adding up an infinite number of dividends. Calculate the present value (PV) of the dividend paid today (Do) and the discounted value of the dividends expected to be paid 10 and 20 years from now (D10 and D20). Assume that the stock's required return (r) is 5.40%. Note: Carry and round the calculations to four decimal places. Time Period Dividend's Expected Expected Dividend's Future Value Present Value Now End of Year 10 $1.5530$0.9178 End of Year 20$2.4117$0.8424 $9.0326 End of Year 50 $0.6513 Using the blue curve (circle symbols), plot the future value of each of the expected future dividends for years 10, 20, The resulting curve will illustrate how the FV of a particular dividend payment will increase depending on how and 50. far from today the dividend is expected to be received. f tho of diuidands to the nearest tenth decimal place before plotting it Chapter 9 Assignment End of Year 50 | $9.0326- L $0.6513 Using the blue curve (drcle symbols), plot the future value of each of the expected future dividends for years 10, 20, and 50. The resulting curve will llustrate how the FV of a particular dividend payment will increase depending on how far from today the dividend is expected to be received. Note: Round each of the discounted values of the of dividends to the nearest tenth decimal place before plotting it on the graph. You can mouse over the points in the graph to see their coordinates. DIVIDENDS IS) 10.00 Expected Dividends 8.00 FV of Dividends 6.00 4.00 2.00 I 10, 0.9 PV of Dividends 0.00 0 1020 30 40 50 60 YEARS Note: Round ean on the graph. You can mouse over the points in the graph to see their coordinates. DIVIDENDS ($) Expected Dividends .O 10.00 8.00 FV of Dividends 6.00 4.00 2.00 20, 0.8 PV of Dividends 0.00 30405060 YEARS 0 10 Clear All Note: Round each of the discounted values of the of dividends to the nearest tenth decimal place on the graph. You can mouse over the points in the graph to see their coordinates DIVIDENDS($) 10.00 Expected Dividends 8.00 FV of Dividends 6.00 4.00 2.00 PV of Dividen 50, 0.7 0.00 0 10 20 30 40 060 YEARS ear
Step by Step Solution
There are 3 Steps involved in it

Get step-by-step solutions from verified subject matter experts