

Question: Attempts Keep the Highest / 4 6. Elasticity and total revenue The following graph shows the daily demand curve for bikes in San Francisco. Use
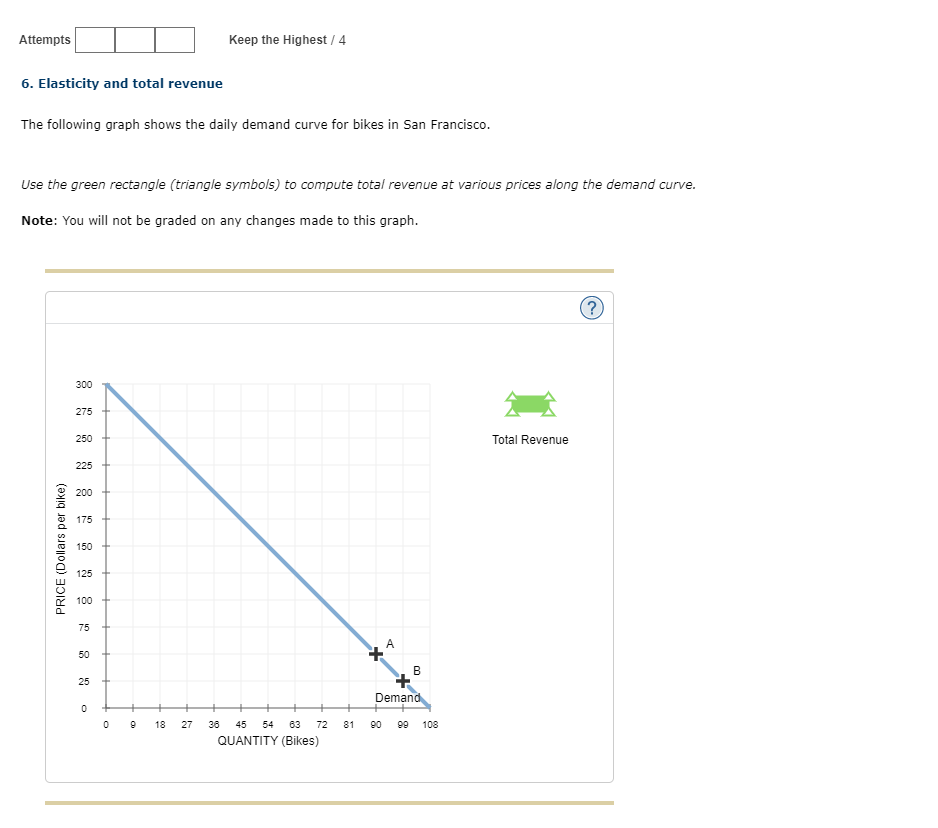
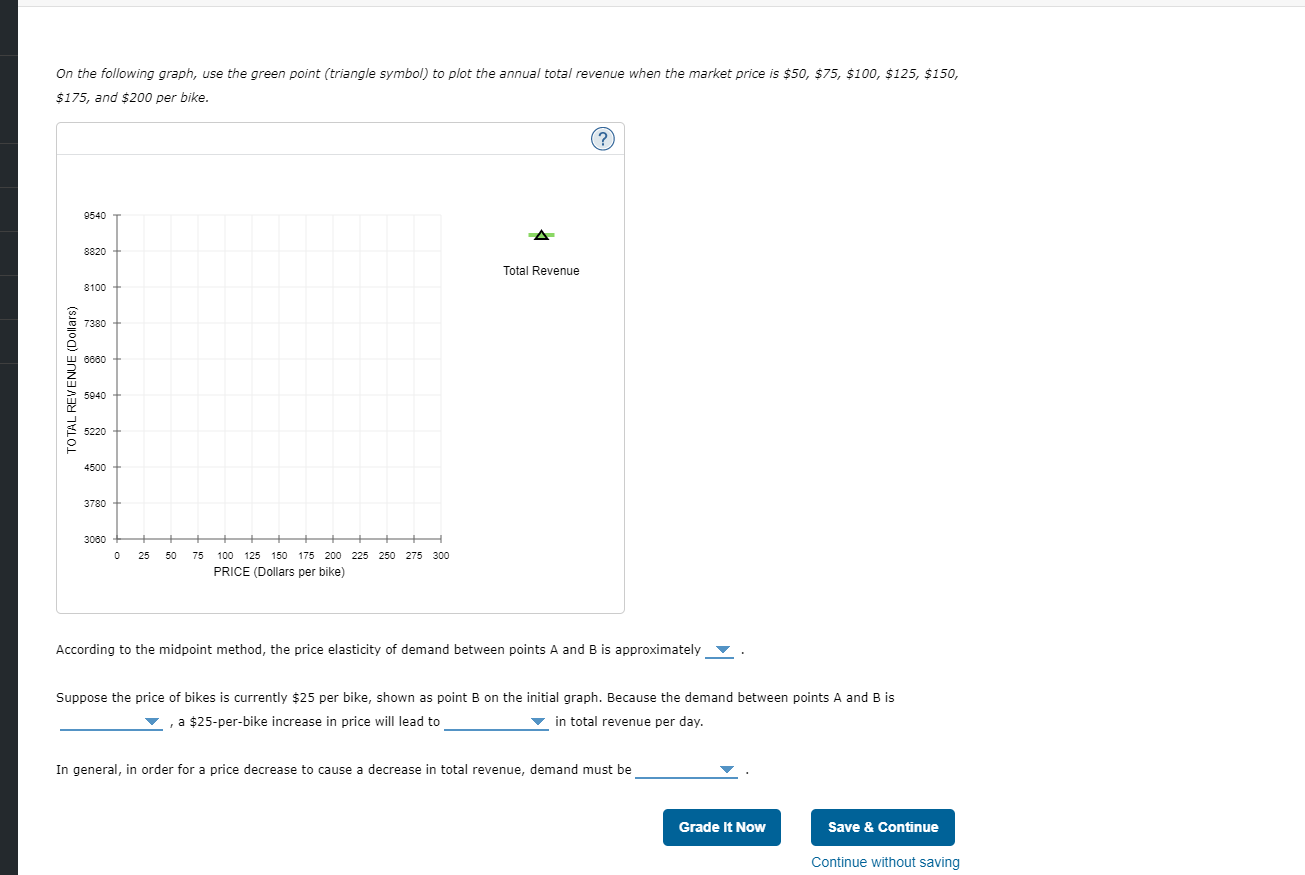
Attempts Keep the Highest / 4 6. Elasticity and total revenue The following graph shows the daily demand curve for bikes in San Francisco. Use the green rectangle (triangle symbols) to compute total revenue at various prices along the demand curve. Note: You will not be graded on any changes made to this graph. (?) 300 Total Revenue PRICE (Dollars per bike) A B 25 Demand 18 27 45 54 63 72 81 90 QUANTITY (Bikes)On the following graph, use the green point (triangle symbol) to plot the annual total revenue when the market price is $50, $75, $100, $125, $150, $175, and $200 per bike. (? ) 9540 8820 Total Revenue 8100 7380 6680 TOTAL REVENUE (Dollars) 5940 5220 4500 3780 3060 0 25 50 75 100 125 150 175 200 225 250 275 300 PRICE (Dollars per bike) According to the midpoint method, the price elasticity of demand between points A and B is approximately Suppose the price of bikes is currently $25 per bike, shown as point B on the initial graph. Because the demand between points A and B is 7, a $25-per-bike increase in price will lead to in total revenue per day. In general, in order for a price decrease to cause a decrease in total revenue, demand must be Grade It Now Save & Continue Continue without saving
Step by Step Solution
There are 3 Steps involved in it

Get step-by-step solutions from verified subject matter experts