

Question: Attempts Keep the Highest/01 5. The capital asset pricing model Rachael holds a portfolio that is invested equally in three stocks. An analyst has used
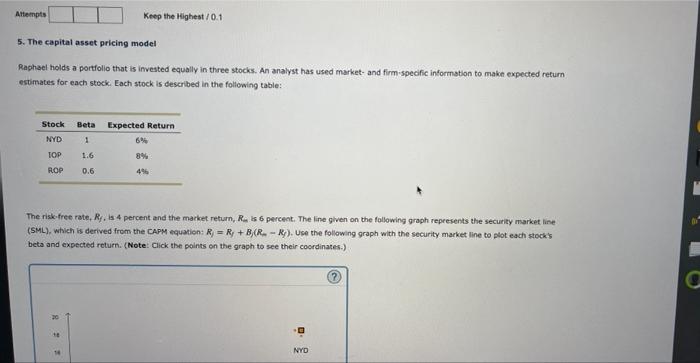
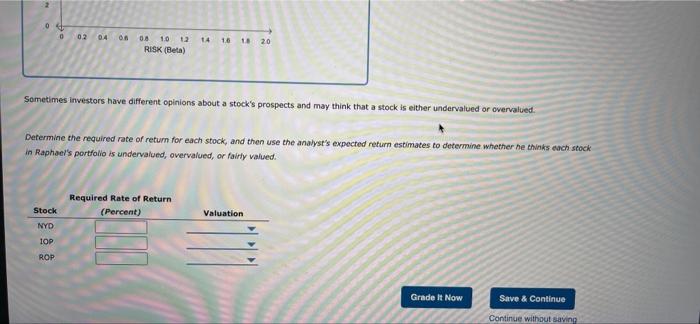
Attempts Keep the Highest/01 5. The capital asset pricing model Rachael holds a portfolio that is invested equally in three stocks. An analyst has used market and firm-specific information to make expected return estimates for each stock. Each stock is described in the following table: Stock NYD Beta 1 1.6 0.6 Expected Return 6% 8% 44 TOP ROP The risk-free rate, R. is 4 percent and the market return, Rais 6 percent. The line given on the following graph represents the security market line (SML), which is derived from the CAPM equation: R = R + BCR-R). Use the following graph with the security market line to plot each stock's beta and expected return. (Note: Click the points on the graph to see their coordinates.) NYD 0 0 02 0.4 On 14 0.8 1.0 12 RISK (Beta) 1.6 1820 Sometimes investors have different opinions about a stock's prospects and may think that a stock is either undervalued or overvalued. Determine the required rate of return for each stock, and then use the analyst's expected return estimates to determine whether he thinks each stock in Raphael's portfolio is undervalued, overvalued, or fairly valued. Required Rate of Return (Percent) Valuation Stock NYD 10P ROP Grade It Now Save & Continue Continue without saving
Step by Step Solution
There are 3 Steps involved in it

Get step-by-step solutions from verified subject matter experts