

Question: Attempts Keep the Highest/1 6. Short-run equilibrium and long-run aggregate supply The following graph shows several aggregate demand and aggregate supply curves for an
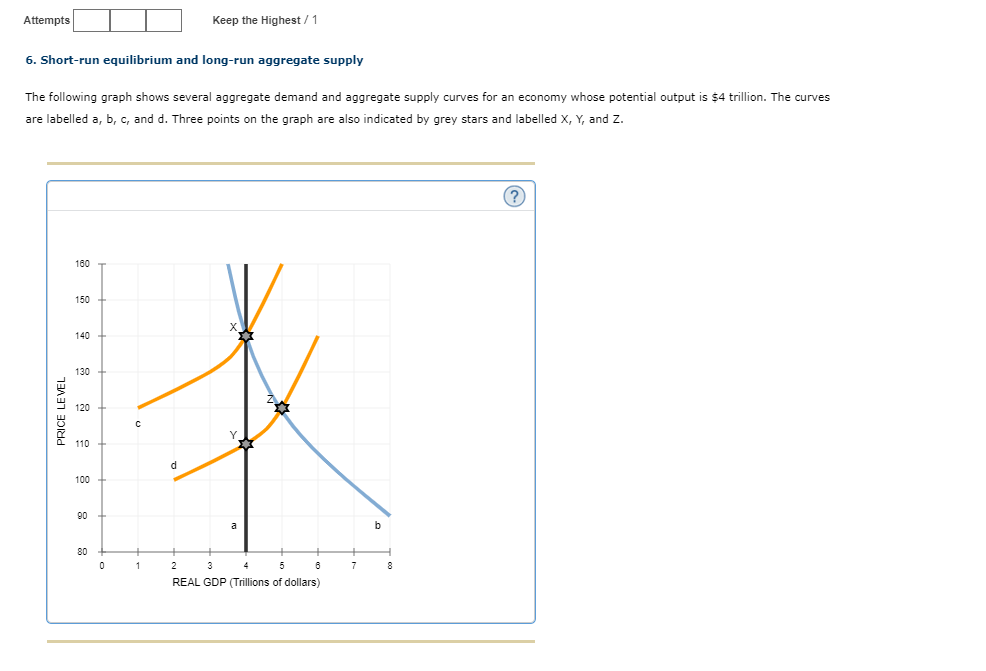
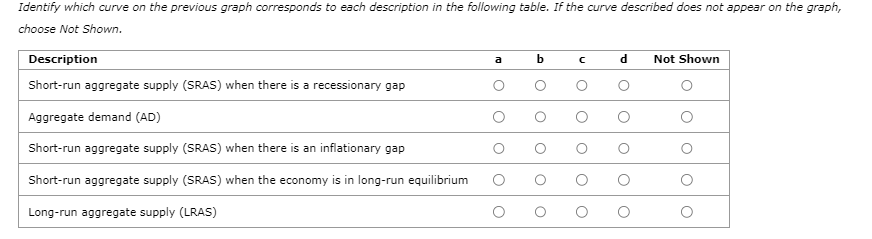
Attempts Keep the Highest/1 6. Short-run equilibrium and long-run aggregate supply The following graph shows several aggregate demand and aggregate supply curves for an economy whose potential output is $4 trillion. The curves are labelled a, b, c, and d. Three points on the graph are also indicated by grey stars and labelled X, Y, and Z. PRICE LEVEL 160 150 X 140 130 120 110 100 90 d a Y Z b 80 + 0 1 2 3 4 5 6 7 8 REAL GDP (Trillions of dollars) (?) Identify which curve on the previous graph corresponds to each description in the following table. If the curve described does not appear on the graph, choose Not Shown. Description a b d Not Shown Short-run aggregate supply (SRAS) when there is a recessionary gap Aggregate demand (AD) Short-run aggregate supply (SRAS) when there is an inflationary gap Short-run aggregate supply (SRAS) when the economy is in long-run equilibrium Long-run aggregate supply (LRAS)
Step by Step Solution
There are 3 Steps involved in it

Get step-by-step solutions from verified subject matter experts