

Question: Attributes vs. Variables ' Attributes data which count (ex. # of complaints) ' Variables data which measure (ex. cm, kg, ml, etc.) ' For each
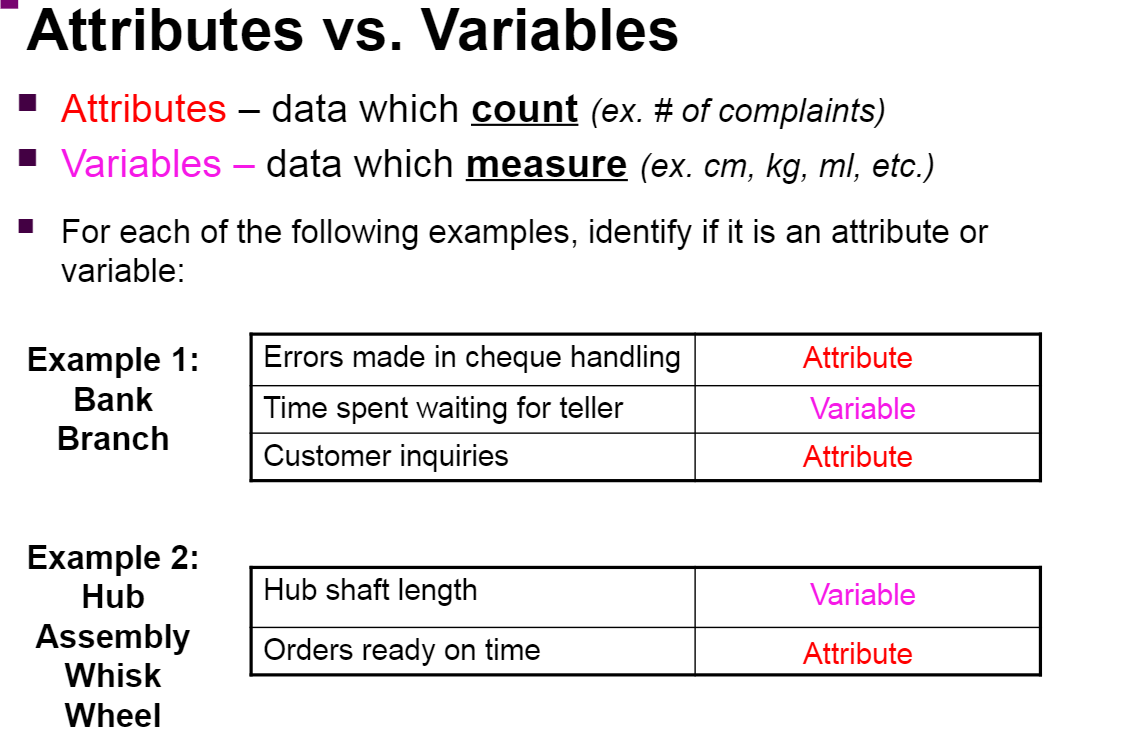
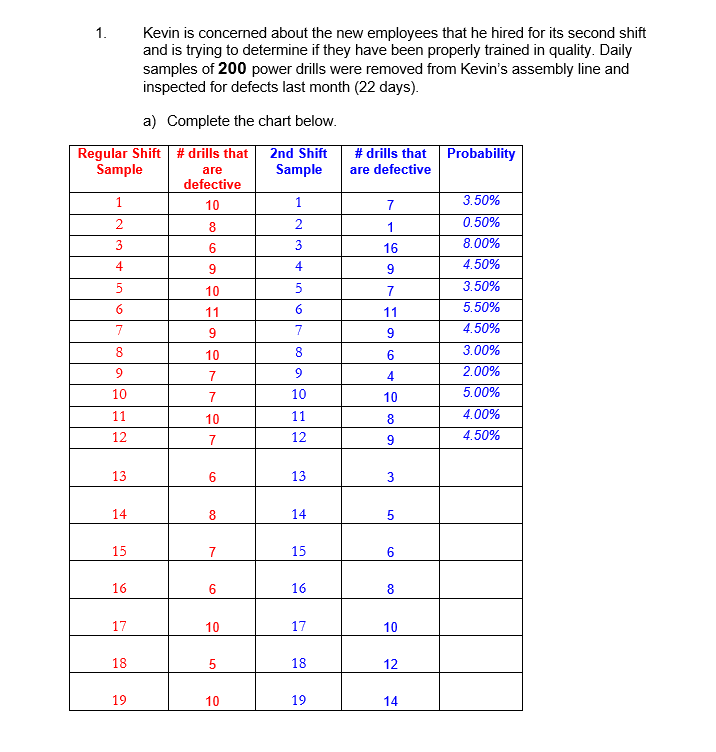
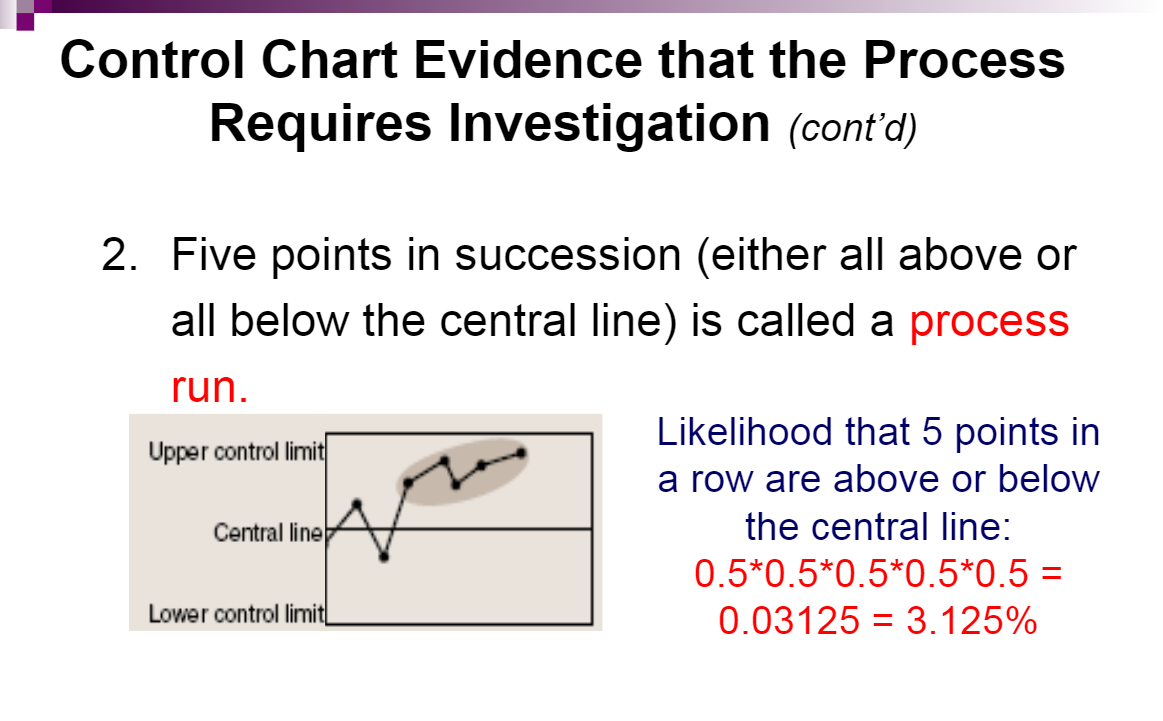
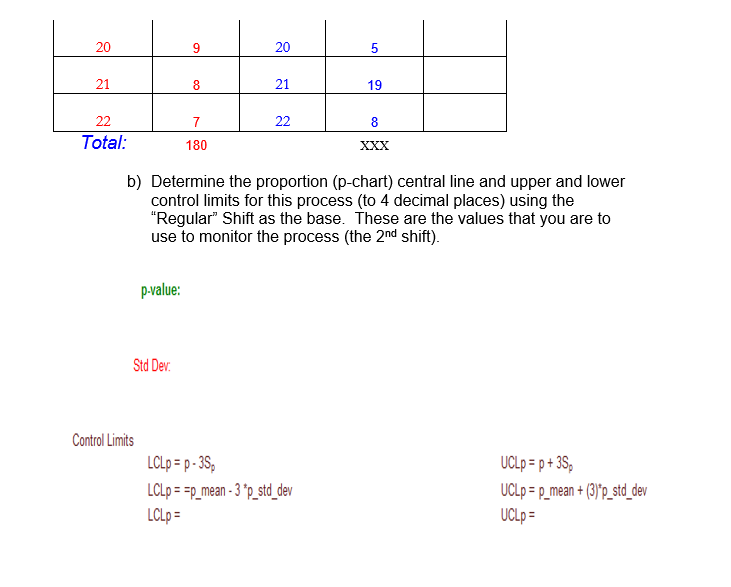
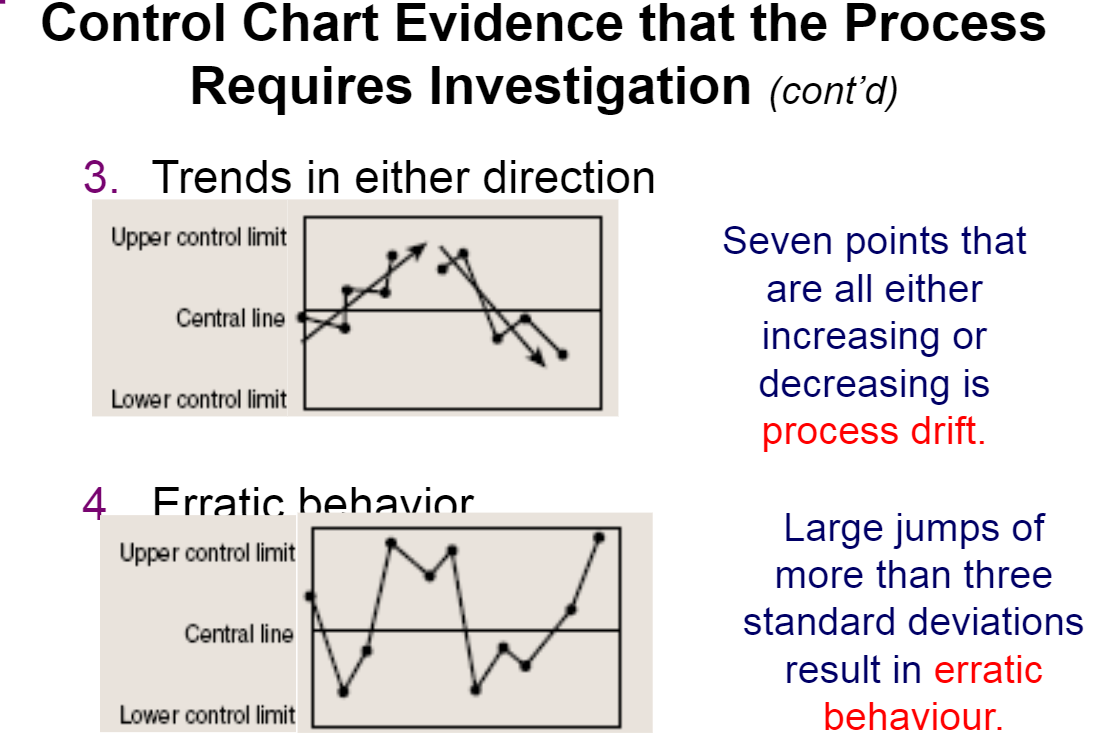
"Attributes vs. Variables ' Attributes data which count (ex. # of complaints) ' Variables data which measure (ex. cm, kg, ml, etc.) ' For each of the following examples, identify if it is an attribute or variable: Example 1: Errors made in cheque handling Attribute Bank Time spent waiting for teller Variable Example 2: Assembly Orders read on time ' . Attribute Whisk y Wheel 1. Kevin is concerned about the new employees that he hired for its second shift and is trying to determine if they have been properly trained in quality. Daily samples of 2D power drills were removed from Kevin's assembly line and inspected for defects last month {22 days). a} Complete the chart below. Regular Shift # drills that nd Shi # [hills that Probability Sample are Sample are defective defective _ Control Chart Evidence that the Process Requires Investigation (cont'd) 2. Five points in succession (either all above or all below the central line) is called a process run. Likelihood that 5 points in a row are above or below Gomlllno the central line: 0.5*0.5*0.5*0.5*0.5 = W'mm'\" 0.03125 = 3.125% 20 9 20 5 21 8 21 19 22 7 22 8 Total: 180 XXX b) Determine the proportion (p-chart) central line and upper and lower control limits for this process (to 4 decimal places) using the "Regular" Shift as the base. These are the values that you are to use to monitor the process (the 2nd shift). p-value: Std Dev. Control Limits LCLp = p - 35p UCLp = p + 35p LCLp = =p_mean - 3 *p_std_dev UCLp = p_mean + (3)"p_std_dev LCLp = UCLp =Control Chart Evidence that the Process Requires Investigation (cont'd) 3. Trends in either direction Upper control limit Seven points that are all either Central line increasing or Lower control limit decreasing is process drift. 4 Frratic behavior Upper control limit Large jumps of more than three Central line standard deviations result in erratic Lower control limit behaviour
Step by Step Solution
There are 3 Steps involved in it

Get step-by-step solutions from verified subject matter experts