

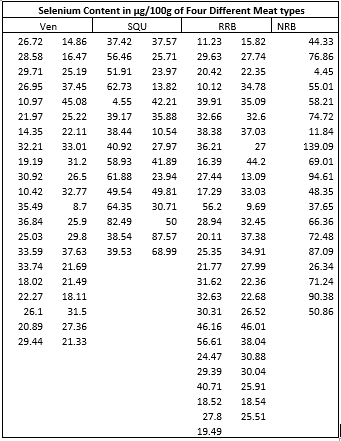
Question: a)Use SPSS to compute ANOVA table for the following data. What does this data show? b)Use dot plot to display data of various types of
a)Use SPSS to compute ANOVA table for the following data. What does this data show?
b)Use dot plot to display data of various types of meat and comment.
c)Illustrate and interpret the use HSD and Bonferroni method for this given data.
Output and solution Spss file uploaded as answer.
\f
Step by Step Solution
There are 3 Steps involved in it
1 Expert Approved Answer
Step: 1 Unlock

Question Has Been Solved by an Expert!
Get step-by-step solutions from verified subject matter experts
Step: 2 Unlock
Step: 3 Unlock