Question: Autosave (D () @ - @- Assingment task Excel 2201AFE - Read-Only 3 Last Modified: 19 September v Q search (Cmd + Ctrl + U)
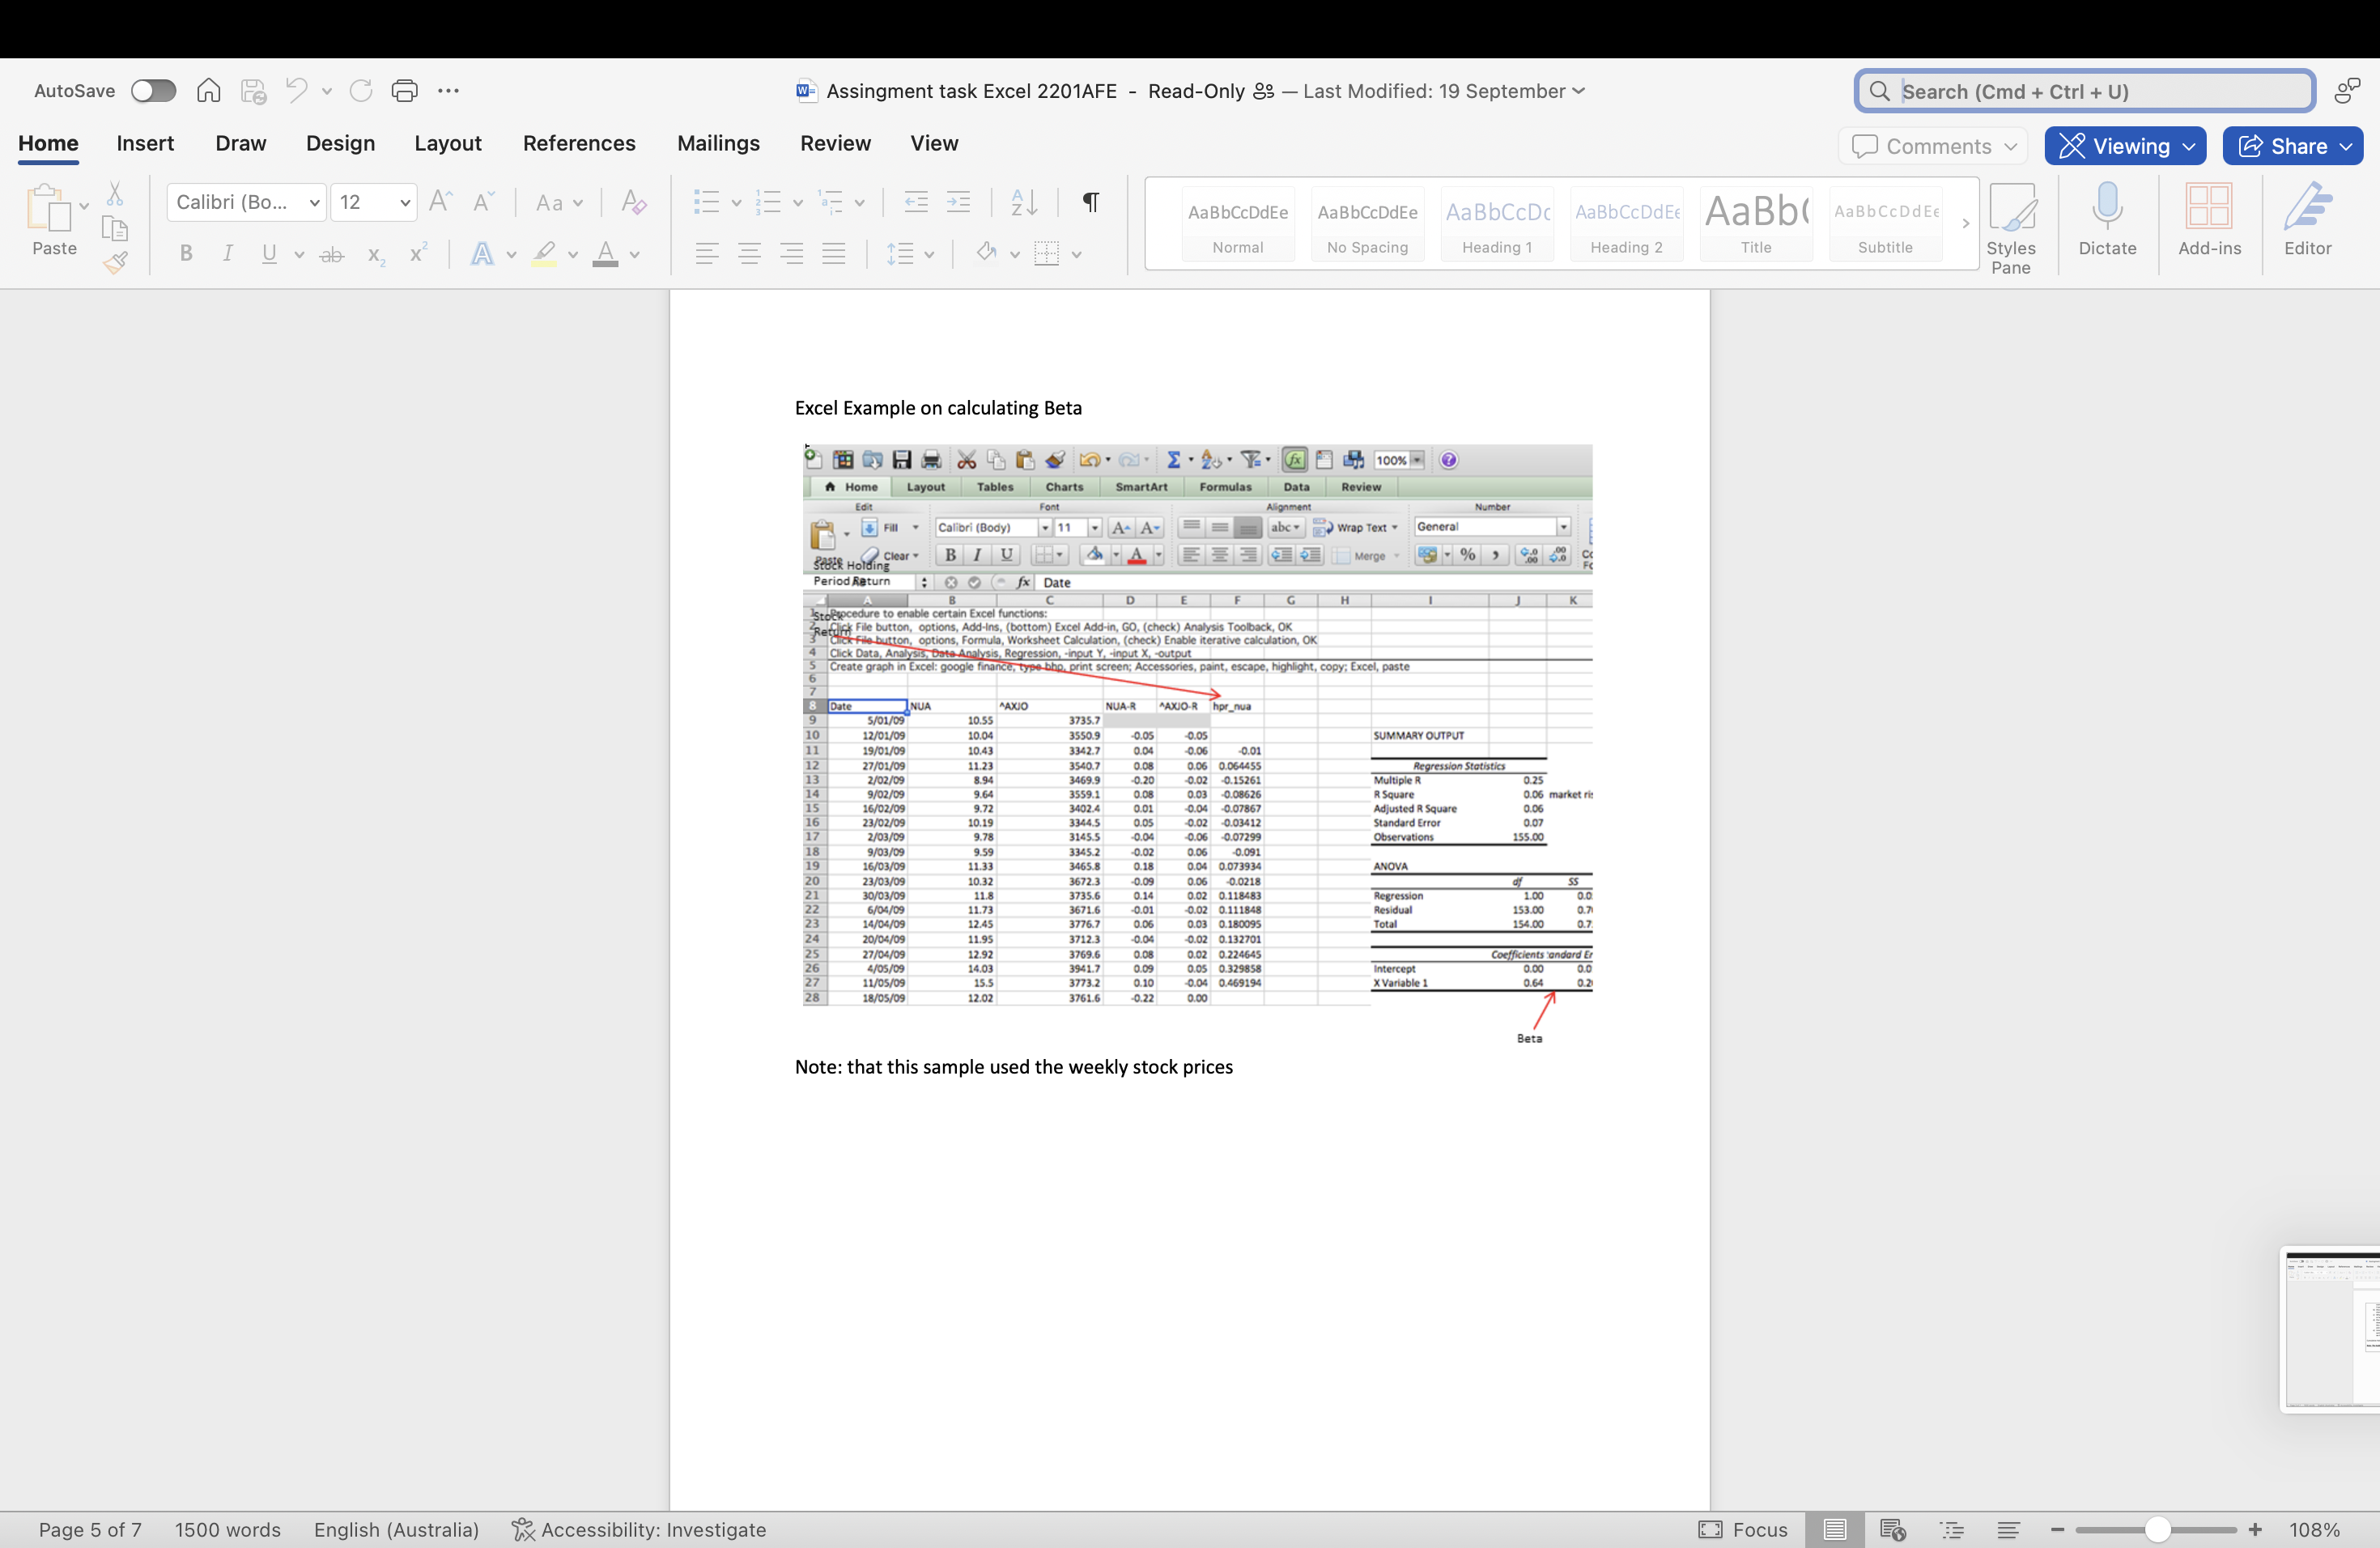
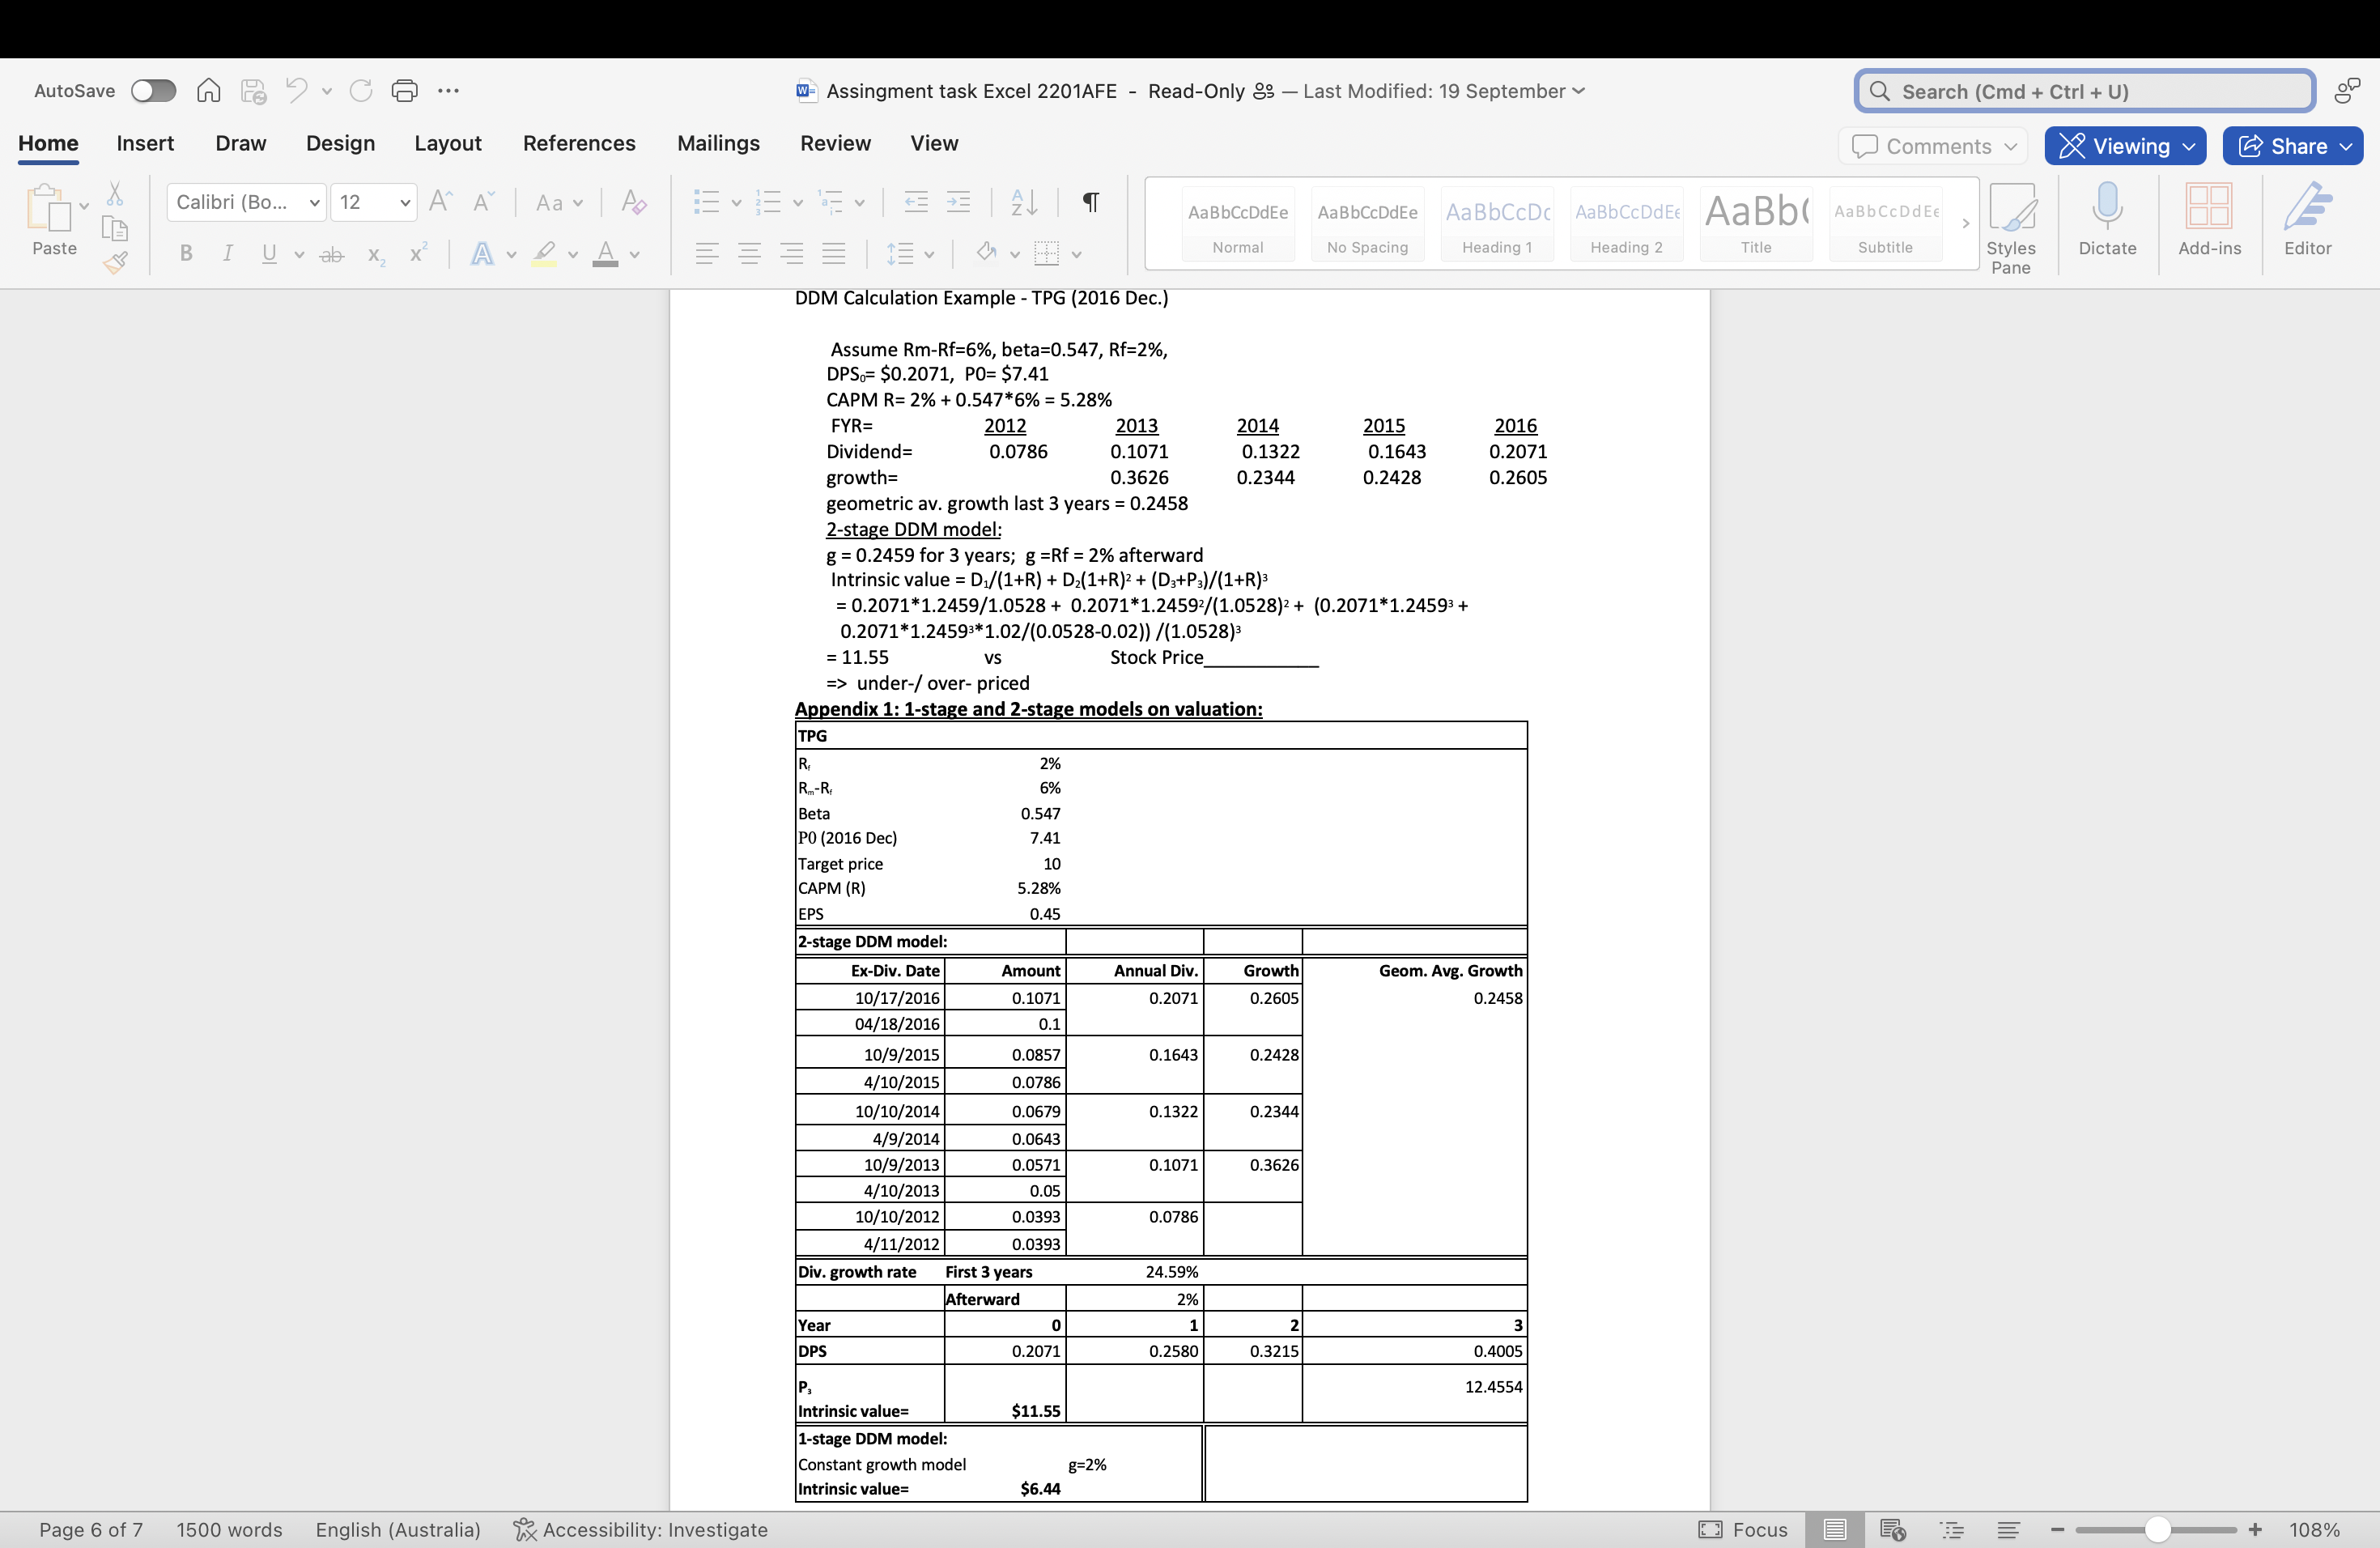
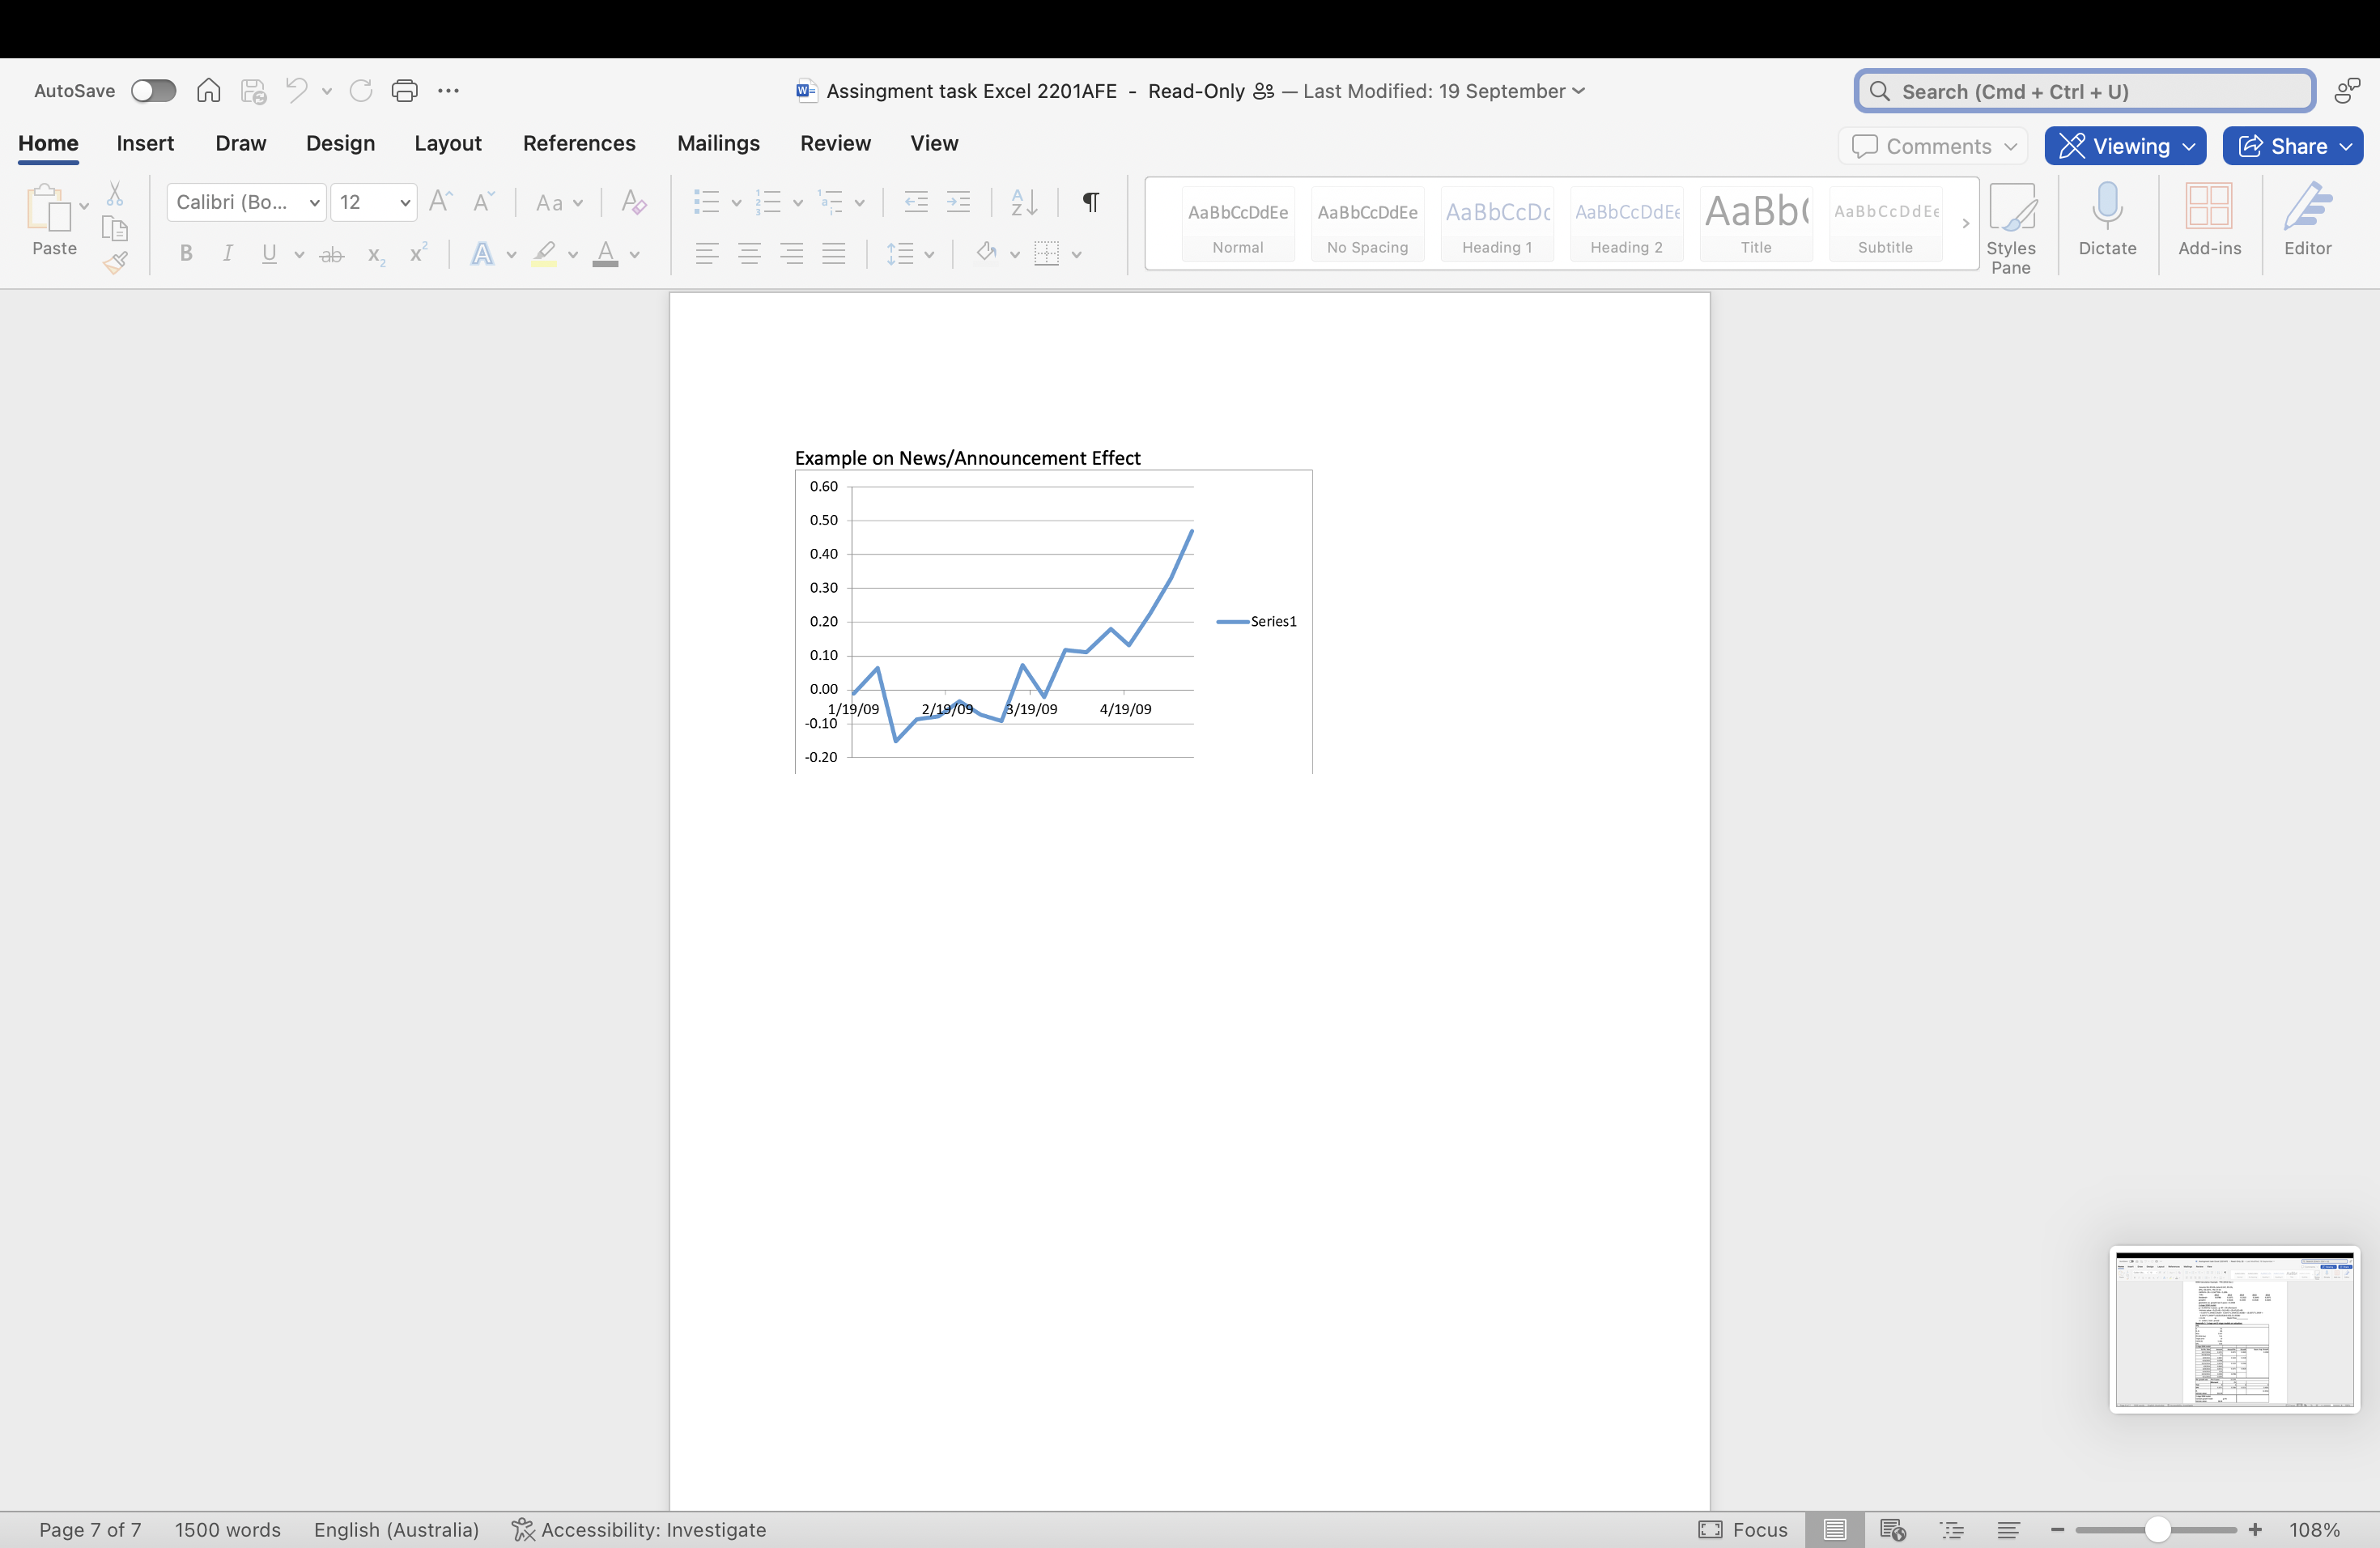
Autosave (D () @ - @- Assingment task Excel 2201AFE - Read-Only 3 Last Modified: 19 September v Q search (Cmd + Ctrl + U) o Home Insert Draw Design Layout References Mailings Review View X L [CEFICRY Calibri (Bo... v 12 v q Paste Styles | Dictate Editor Pane ead Only To save a copy of this document, click Duplicate. uplicate Read Only T f this d t, click Duplicats Duplicat Case Scenario You have recently started an internship position with Griffith Equity Management (GEM), a large asset management company with A$750 million Assets Under Management located in Brisbane CBD. The company''s core investment focuses on domestic share market, however, investments in share markets have provided lower than expected returns in the recent years. GEM's Chief Investment Officer (CIO) has assigned you to perform an investment appraisal on a single company listed on the ASX300 and provide recommendation if the company analysed should be included as part of GEM's investment. Your personal values and experiences are important, you should base your response on the evidence provided in these tasks along with your knowledge gained in the course. It is important that you provide clear evidence of your ability to apply your knowledge of finance as learned in the course to the task. The CIO has requested that your analysis must be up-to- date analysis with at least 3 years of data. Price data should include data to the end of recent financial year. Your report must address the following issues: 1. Abriefdescription of the company and explain if the company may face any challenges in the future (for example, competition, technological/environmental risk and so on). 2. Analysis of the company's share price using: i) Capital Asset Pricing Model i) Dividend Discount Model (1-stage and/or 2-stage). You will determine if the share price is priced fairly or over/under-valued. iii) Compare the company's P/E ratios with other competitors in the industry. Explain if the company is doing better or worse than other competitors. iv) News/Announcement effect on company's share price. You will investigate the speed of share price adjustment to these announcements using graphs. You will discuss the share performance over the last 3 years, showing the major events (announcements) in the life of the company and discuss how these events (announcements) have impacted the share price. One of the events discussed should be recent. v) You will need to show all calculations in Excel with cell referencing, showing formula and where the numbers are fitted in the Excel formula. Your current internship position is under 3 months' probation period. Upon completing the task on hand, your department secretary will arrange a meeting with CIO to discuss whether you have passed the probation period and be promoted to a Junior Corporate Finance Analyst. - + 108% Page 2 of 7 1500 words English (Australia) i'; Accessibility: Investigate (3 Focus E Autosave (D () @ - @- Assingment task Excel 2201AFE - Read-Only 3 Last Modified: 19 September v Q [search (Cmd + Ctrl + U) o Home Insert Draw Design Layout References Mailings Review View X L [CEFICRY Calibri (Bo vi12 v q Paste Styles Dictate Editor Pane Provided here is a guide on how to approach the assignment. You can use this as a template for your assignment or feel free to get creative in writing your excel assignment. 1. Abrief description of the company and explain if the company may face any challenges in the future (for example, competition, technological/environmental risk and so on). 2. Analysis of company's share price using Capital Asset Pricing Model a) To calculate CAPM, you will first need to calculate the beta of the company with the market (ASX300). b) Stock beta: Download 3 years of weekly company share price returns and ASX300 market index returns ending financial year from Yahoo Finance (or other data sources) and estimate the stock beta. c) Does the estimate of stock beta make sense to you? (The normal range of beta is from 0.5 to 3). Provide reasoning, why or why not? If not, you have to use the stock beta from Yahoo Finance for the later parts. d) Estimate the Expected Return using CAPM formula E(R)=Rf+Beta*[E(Rm)-Rf] (This may be used for later part in calculating the DDM). Assume the market return, Rm = 6.5%, and use the current 10-year Government bond yield for the risk-free rate = 3.5%. 3. Analysis of company's share price using Dividend Discount Model a) DPS is the total annual dividend per share paid for the financial year. Based on the previous 5-year pattern of DPS payments, estimate the intrinsic values using 1-stage models (the constant dividend growth model), and/or the 2- stage non-constant dividend growth model. Please use the 10-year Government bond yield as the Dividend growth rate in the equilibrium stage. b) You need to choose which model (1 stage or 2 stage) is the most appropriate one to use and compare the intrinsic value versus the share price as of end of financial year ('current price'). c) Comment on whether the company share price is overpriced or underpriced. d) Would you recommend buying or sell the shares as of end of financial year? Note: In stock valuation your decisions are based on the estimates of variables and if you make an error in these estimates your decisions can be wrong resulting in significant losses. By considering a range of these estimates you test robustness of your results and as such see how your decisions stack up in case your estimates are incorrect by up to 10%. This is a simple example there are other ways for testing robustness of results statistically. 4. Compare the company's P/E ratios with other competitors in the industry. Explain if the company is doing better or worse than other competitors. 5. News/Announcement effect on company's share price. a) You will study ONE announcement from this company from ASX 300 firms (https://www.asx300list.com/). The announcement can be a new product, a Page 3 of 7 1500 words English (Australia) Accessib'\\l[ly: Investigate [ Focus E = - + 108% Autosave (D () @ - @ Assingment task Excel 2201AFE - Read-Only &3 Last Modified: 19 September ~ Q search (Cmd + Ctrl + U) o Home Insert Draw Design Layout References Mailings Review View X L [CES IR Calibri (Bo.. v 12 v T Paste Dictate Editor scandal, an earnings announcement, a change in strategy and others in the last 3 years. Discuss how these events (announcements) have impacted the company's share price. c) What is your expectation of the market reaction to the announcement, good or bad news? Plot the share price during the announcement period on a graph. Please download the daily stock prices from one month before to one month after the announcement date and compute the cumulative holding period returns and plot them in a graph. e) Using the graph, discuss the following aspects: Does the stock price react quickly or slowly to the news announcement? How does it relate to the theory we learned in class? b d Cumulative Holding period returns = [(1+r,)(1+r;) (1+rs)...( 14r)]-1 Note: The holding period return is NOT the usual weekly return you calculated Page 3 of 7 1500 words English (Australia) 7?; Accessibility: Investigate [ Focus = - + 108% AutoSave O A H8 5 . C G ... W Assingment task Excel 2201AFE - Read-Only 89 - Last Modified: 19 September Q Search (Cmd + Ctrl + U) OF Home Insert Draw Design Layout References Mailings Review View Comments Viewing Share Calibri (Bo... v 12 A A Aa AaBbCcDdEe AaBbCcDdEe AaBbCcDc AaBbCcDdE AaBb( AaBbCCDdEE , Paste BIUvab X X A DAY Norma No Spacing Heading 1 Heading 2 Title Subtitle Styles Dictate Add-ins Editor Pane Excel Example on calculating Beta A Home Layout Tables Charts SmartArt Formulas Data Review Edit &Fill . Calibri (Body) - 11 - A- A- abc Wrap Text " General Seats Ho Clear . B I U- & A- Merge * % " 858 Period Return : fx Date D G H Stolsecedure to enable hable certain Excel functions: Return the button, options, Add-Ins, (bottom) Excel Add-in, Click Data, Analysis Date Analysis, Regression -inout y only enable iterative calculation, OK Create graph in Excel: google finance, type-bho, print screen; Accessories, paint, escape, highlight, copy; Excel, paste 6 8 Date NUA-R "AXIO-R hpr_nua 10.55 3735.7 12/01/0 10.04 SUMMARY OUTPUT 19/01/0 10.43 -0.05 27/01/0 0.15261 Multiple R 0.25 Squares 06 market ri 8.03412 Adjusted R Square standard Error 0.06 0.07299 Observations 155.00 11.33 104 0.073934 ANOVA 3735.6 1.00 11.73 3776.7 2.02 8:111848 Residual 153.00 Total 154.00 11.95 3712.3 12.92 0.02 0.132701 3773.2 0.10 X Variable 1 18/05/09 12.02 3761.6 Note: that this sample used the weekly stock prices Page 5 of 7 1500 words English (Australia) Accessibility: Investigate Focus E + 108%AutoSave O A H8 5 . C G ... W Assingment task Excel 2201AFE - Read-Only 89 - Last Modified: 19 September Q Search (Cmd + Ctrl + U) OF Home Insert Draw Design Layout References Mailings Review View Comments Viewing Share Calibri (Bo... v 12 A A Aa AaBbCcDdEe AaBbCcDdEe AaBbCcDc AaBbCcDdEE AaBb( AaBbCcDdEE , Paste BIUvab X X A DAY BE Normal No Spacing Heading 1 Heading 2 Title Subtitle Styles Dictate Add-ins Editor Pane DDM Calculation Example - TPG (2016 Dec.) Assume Rm-Rf=6%, beta=0.547, Rf=2%, DPSo= $0.2071, PO= $7.41 CAPM R= 2% + 0.547*6% = 5.28% FYR= 2012 2013 2014 2015 2016 Dividend= 0.0786 0.1071 0.1322 0.1643 0.2071 growth= 0.3626 0.2344 0.2428 0.2605 geometric av. growth last 3 years = 0.2458 2-stage DDM model: g = 0.2459 for 3 years; g =Rf = 2% afterward Intrinsic value = D1/(1+R) + D2(1+R)2 + (D3+P3)/(1+R)3 = 0.2071*1.2459/1.0528 + 0.2071*1.24592/(1.0528)2 + (0.2071*1.24593 + 0.2071*1.24593*1.02/(0.0528-0.02)) /(1.0528)3 = 11.55 Stock Price_ => under-/ over- price Appendix 1: 1-stage and 2-stage models on valuation: TPG 2% R-R 6% Beta 0.547 PO (2016 Dec) 7.41 Target price 10 APM (R) 5.28% EPS 0.45 2-stage DDM model: Ex-Div. Date Amount Annual Div. Growth Geom. Avg. Growth 10/17/201 0.1071 0.2071 0.2605 0.2458 04/18/2016 0.1 10/9/2015 0.0857 0.1643 0.2428 1/10/2015 0.0786 0/10/2014 0.0679 0.1322 0.2344 4/9/2014 0.0643 10/9/2013 0.0571 0.1071 0.3626 4/10/2013 0.05 0/10/2012 0.0393 0.0786 4/11/2012 0.0393 Div. growth rate First 3 years 24.59% Afterward 2% Year 0 DPS 0.2071 0.258 0.3215 0.4005 12.4554 Intrinsic value= $11.55 I-stage DDM model: Constant growth model 8=2% Intrinsic value= $6.44 Page 6 of 7 1500 words English (Australia) fox Accessibility: Investigate Focus E + 108%AutoSave O A H8 5 . C G ... W Assingment task Excel 2201AFE - Read-Only 89 - Last Modified: 19 September Q Search (Cmd + Ctrl + U) OF Home Insert Draw Design Layout References Mailings Review View Comments Viewing Share Calibri (Bo... v 12 A A Aa AaBbCcDdEe AaBbCcDdEe AaBbCcDc AaBbCcDdE AaBb( AaBbCCDdEE , Paste BIUvab X X|A DAY Norma No Spacing Heading 1 Heading 2 Title Subtitle Styles Dictate Add-ins Editor Pane Example on News/Announcement Effect 0.60 0.50 0.40 0.30 0.20 -Series1 0.10 0.00 0.17/19/09 2/19/09 B/19/09 4/19/09 -0.20 Page 7 of 7 1500 words English (Australia) Accessibility: Investigate Focus + 108%
Step by Step Solution
There are 3 Steps involved in it
1 Expert Approved Answer
Step: 1 Unlock
Question Has Been Solved by an Expert!
Get step-by-step solutions from verified subject matter experts
Step: 2 Unlock
Step: 3 Unlock
Students Have Also Explored These Related Finance Questions!