

Question: AutoSave Home Insert . Page Layout ICE 8-1 Draw Formulas Data Review View 11 A = = Wrap Text Calibri (Body) B I H A
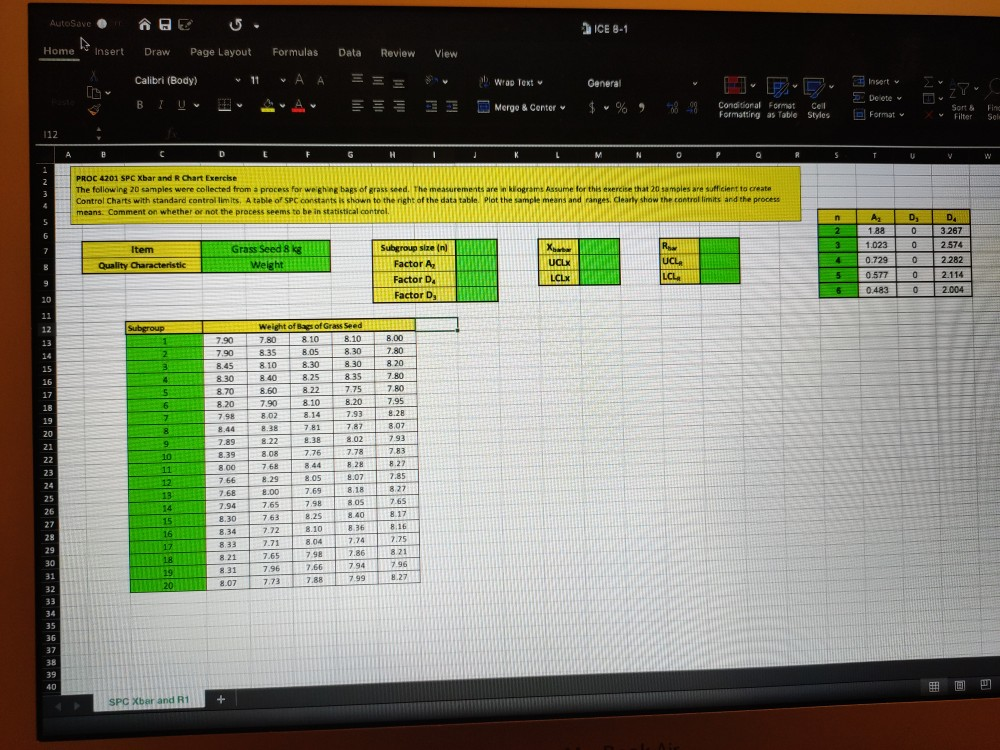
AutoSave Home Insert . Page Layout ICE 8-1 Draw Formulas Data Review View 11 A = = Wrap Text Calibri (Body) B I H A M A = E General $%93- ZI Delete Morgo & Contor Conditional Format Formatting as Table Cell Styles Format Sort & Filter Find Sel PROC 4201 SPC Xbar and R Chart Exercise The following 20 samples were collected from a process for weighing bags of grass seed. The measurements are in kilograms Assume for this exercise that 20 samples are sufficient to create Control Charts with standard controllimits. A table of SPC constants shown to the night of the datatable Plot the sample means and r es clearly show the controllimits and the process means. Comment on whether or not the process seems to be in statistical control Subgroup size (n) Item Quality Characteristic Grass Seed 8 kg Weight n ADD 218803267 31.023 02574 40.7290 2.282 5 0 .577 2.114 60.48302.004 Factor A 09 Factor D LCLAI Factor D 7.90 7.90 8.45 830 8.70 8.20 7.98 Weight of Bags of Grass Seed 7.80 8.10 8.10 8 ,00 8.35 8.05 8.30 7.80 8.10 8.30 8.30 8.20 840 8.25 8 357 80 8.60 8.22 780 7.90 8.10 8.20 8.02 8.14 19.28 781 7.87 8.07 8.22 8.38 8.02 8.08 7.95 8.44 7.89 8.39 8.00 7.66 7.68 9.07 8.00 7.65 7.94 7.72 2.70 2.75 8.30 8.34 8.33 17.71 821 7.65 8.31 7.96 8.07 SPC Xbar and 1
Step by Step Solution
There are 3 Steps involved in it
1 Expert Approved Answer
Step: 1 Unlock

Question Has Been Solved by an Expert!
Get step-by-step solutions from verified subject matter experts
Step: 2 Unlock
Step: 3 Unlock