Question: AutoSave MAGIC ... Lab 8-1 SP100 Facts_substitute Home Insert Draw Page Layout Formulas Data Review View Automate Developer PivotTable Analyze Design Tell me Comments Share
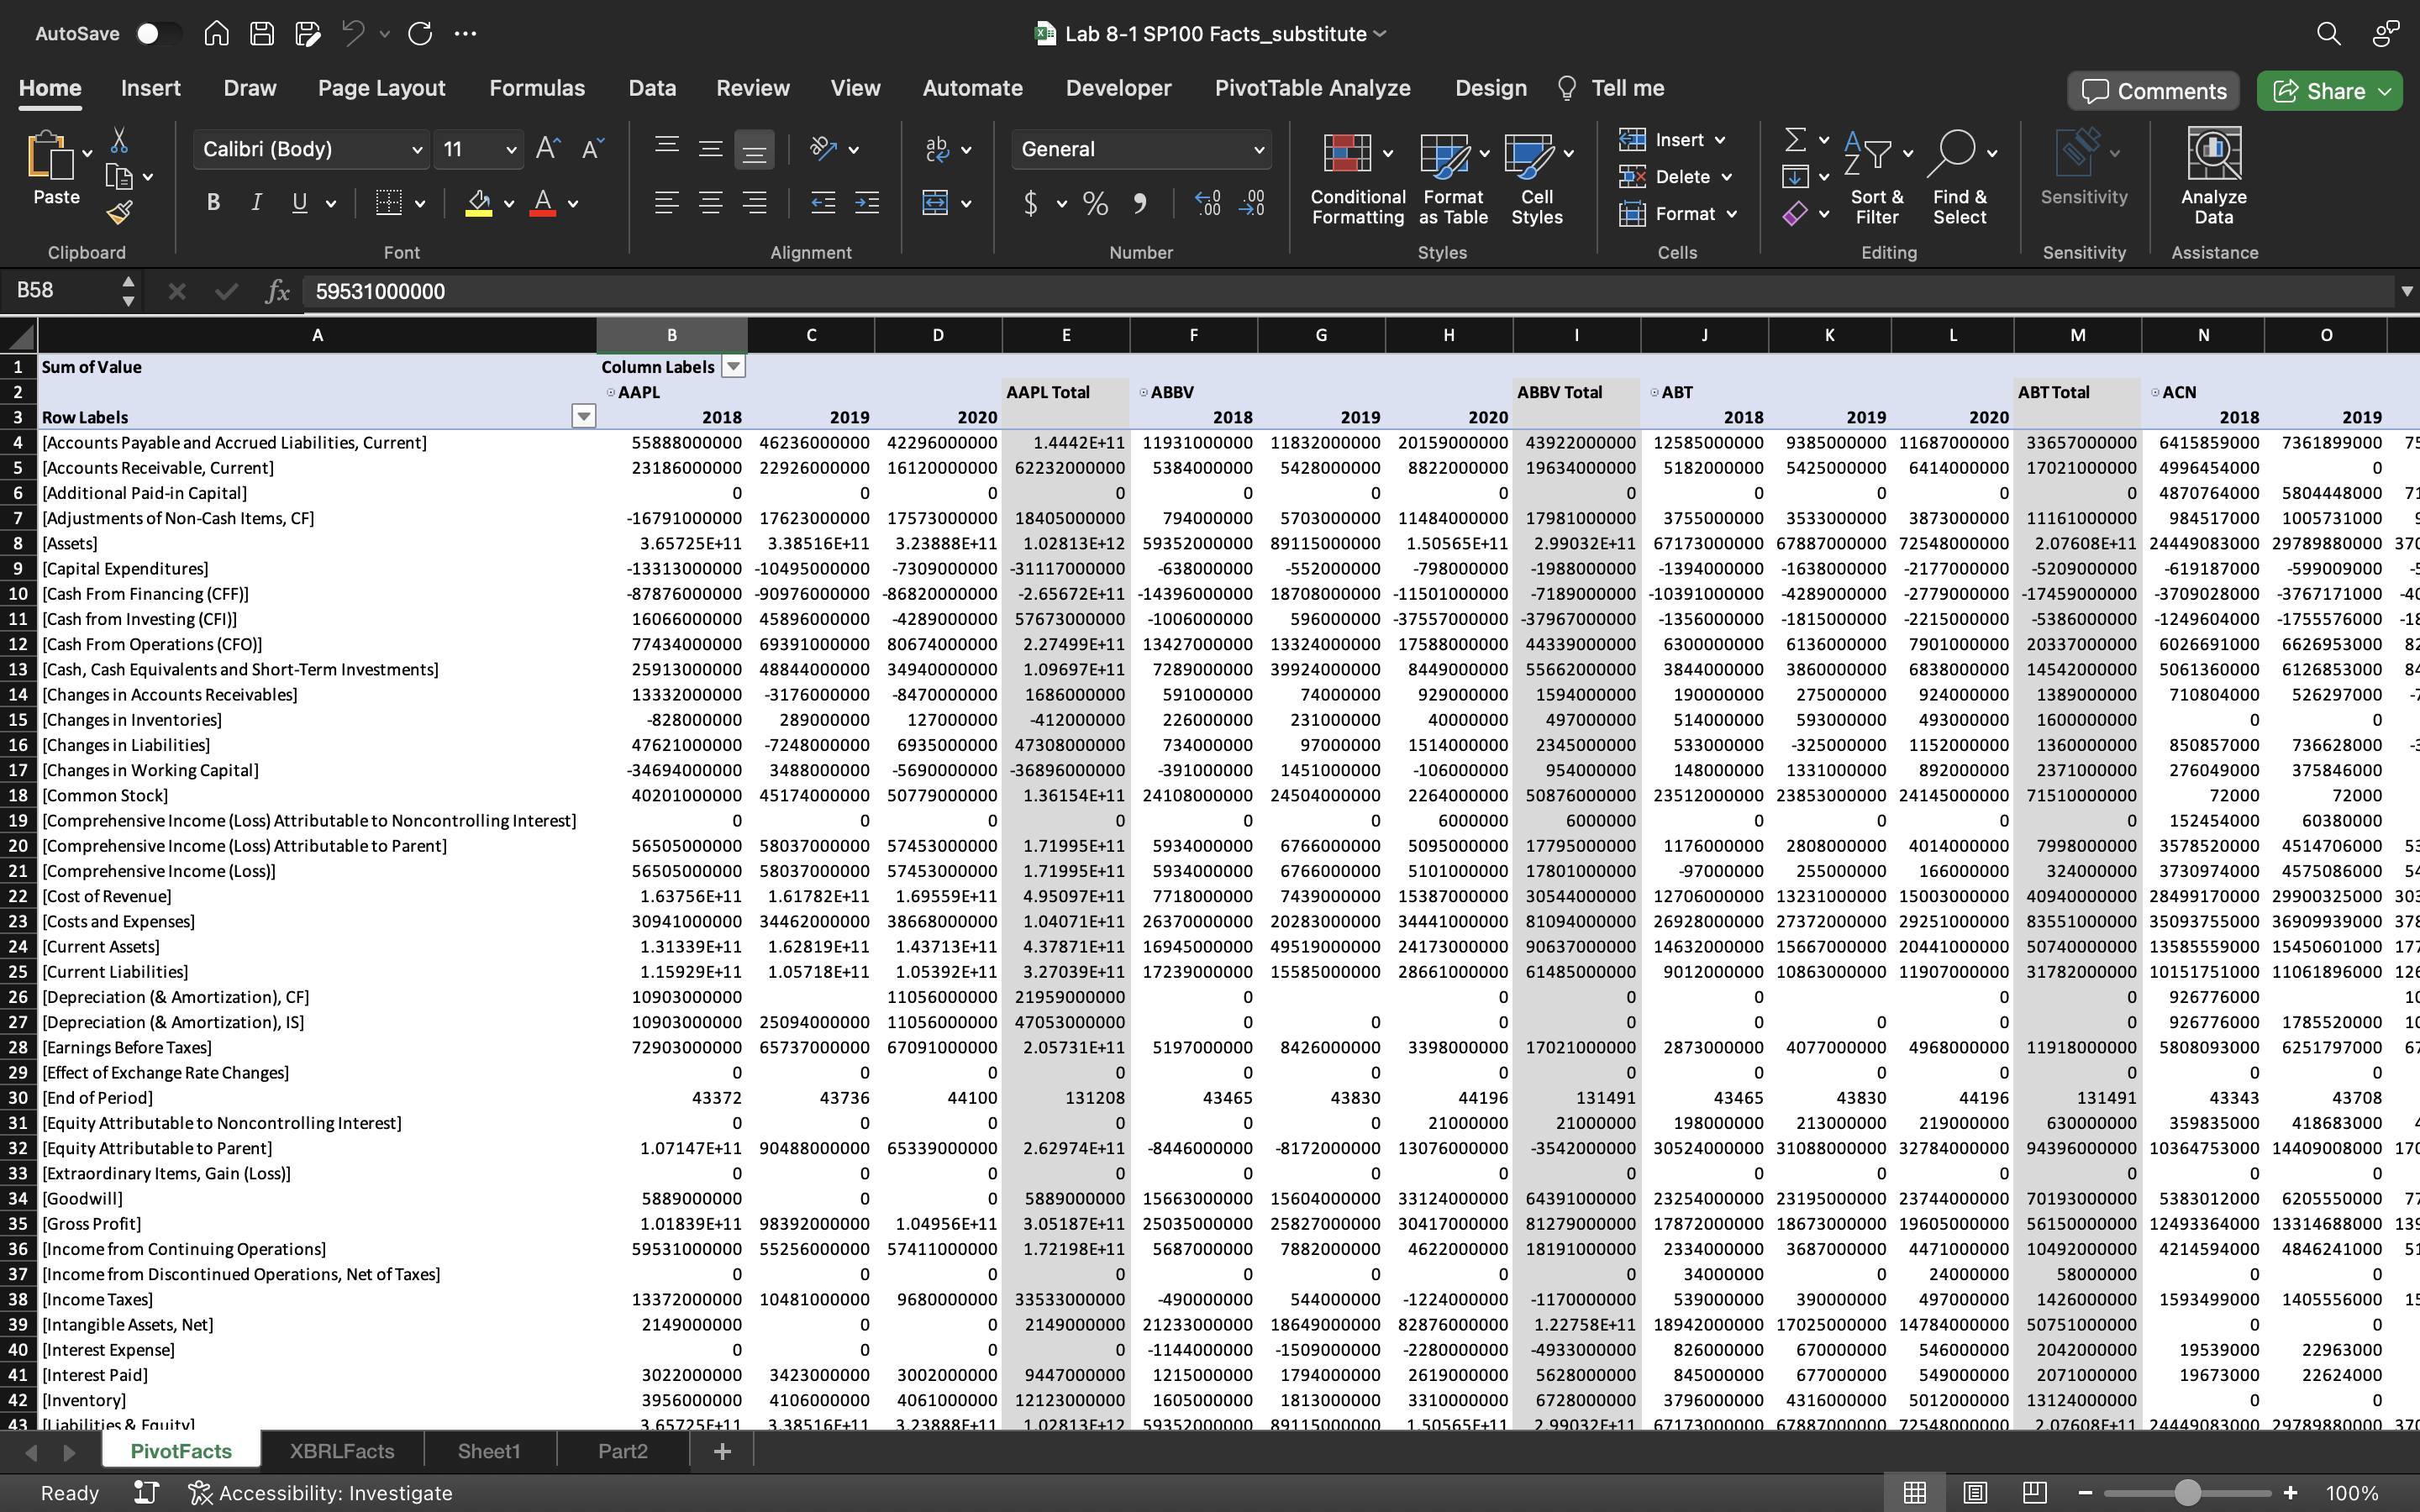
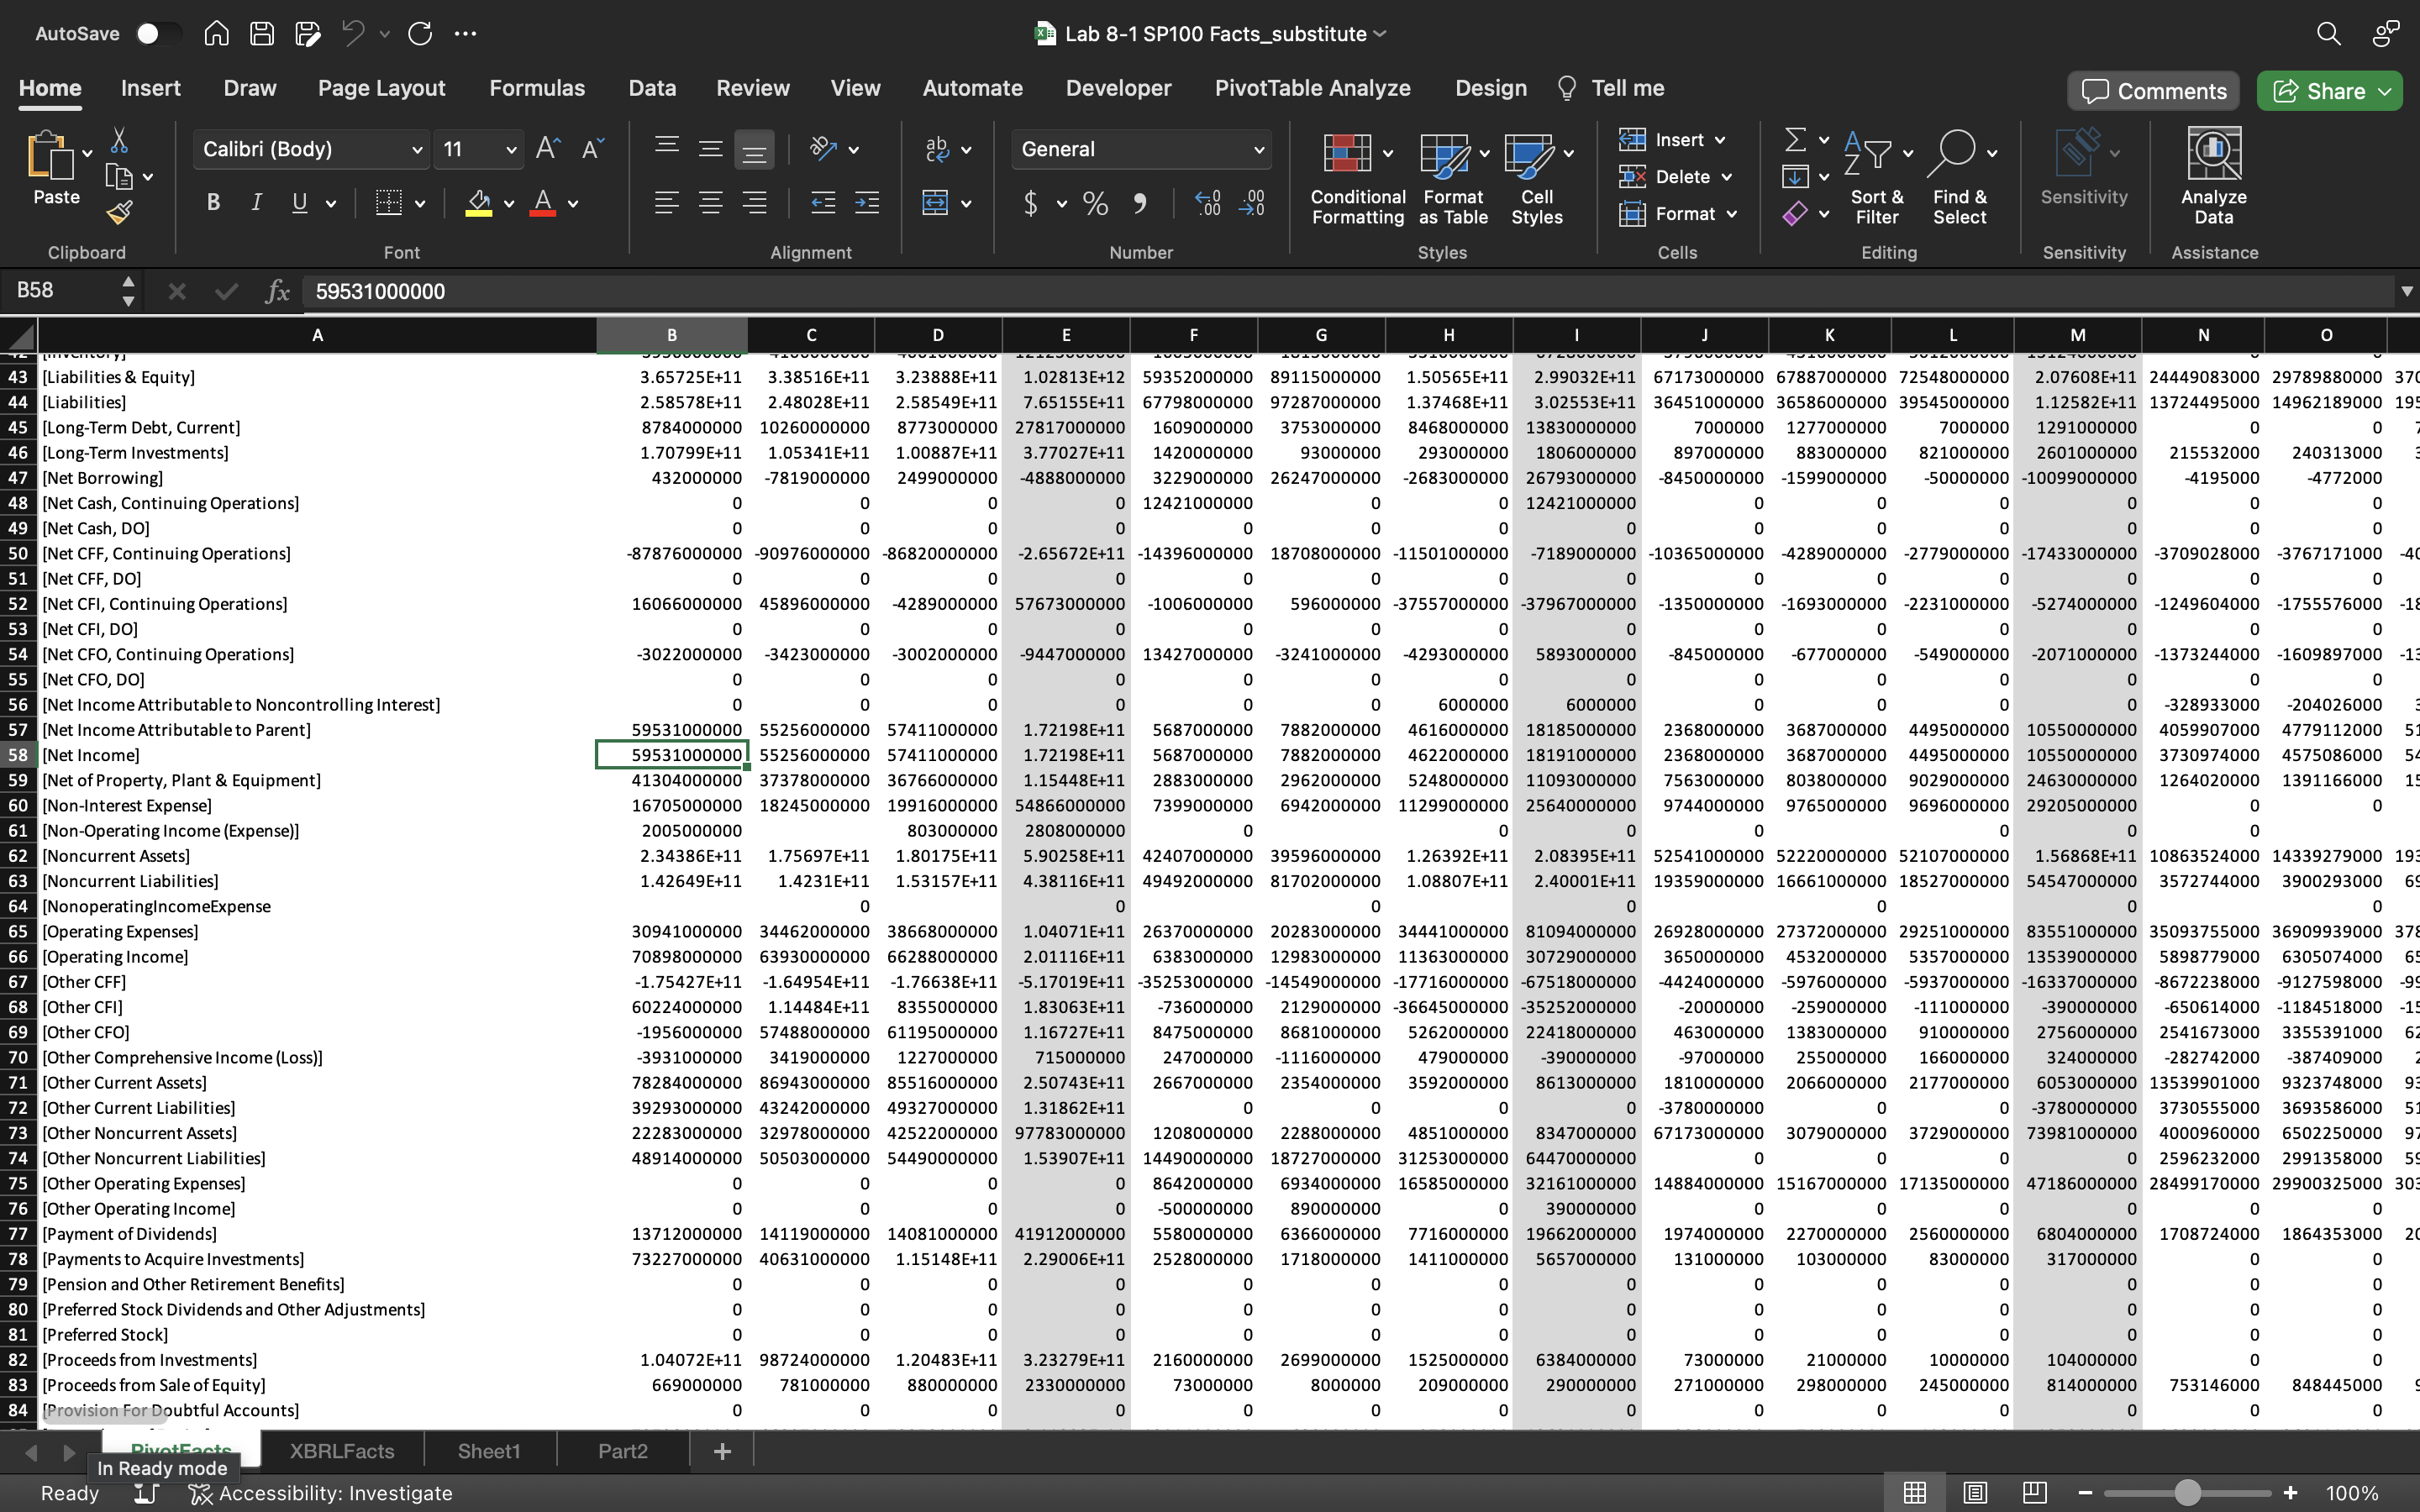
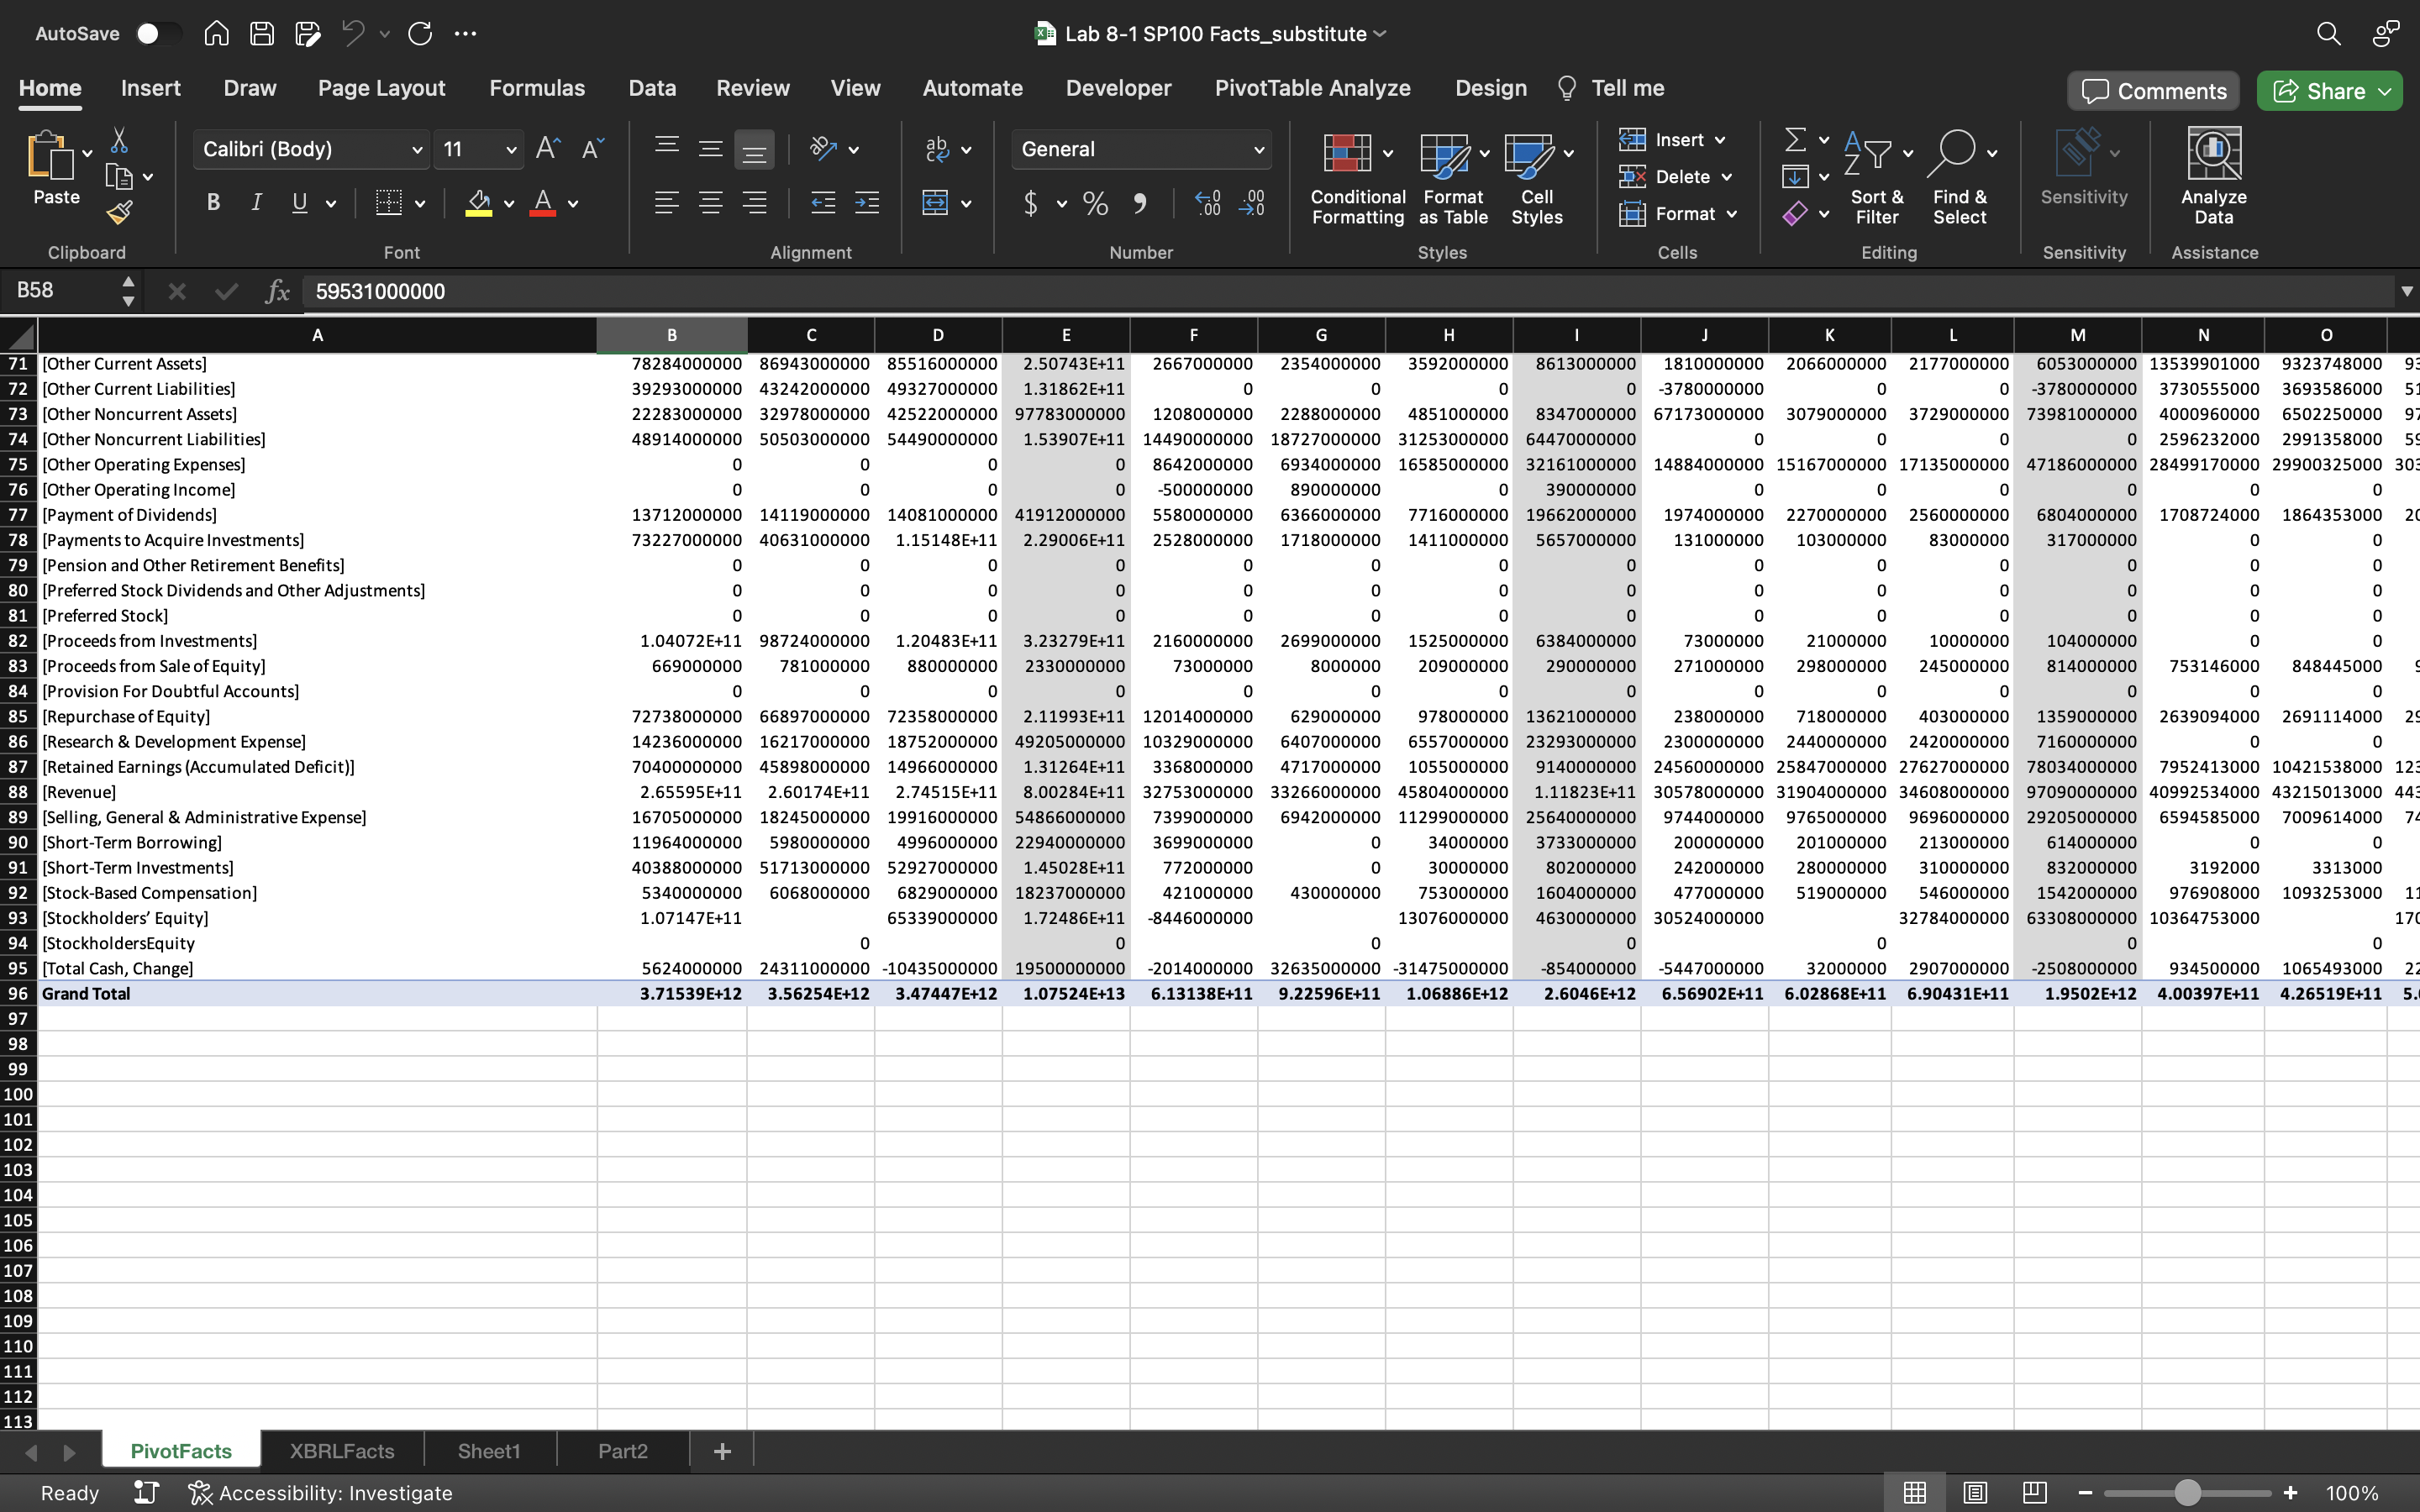
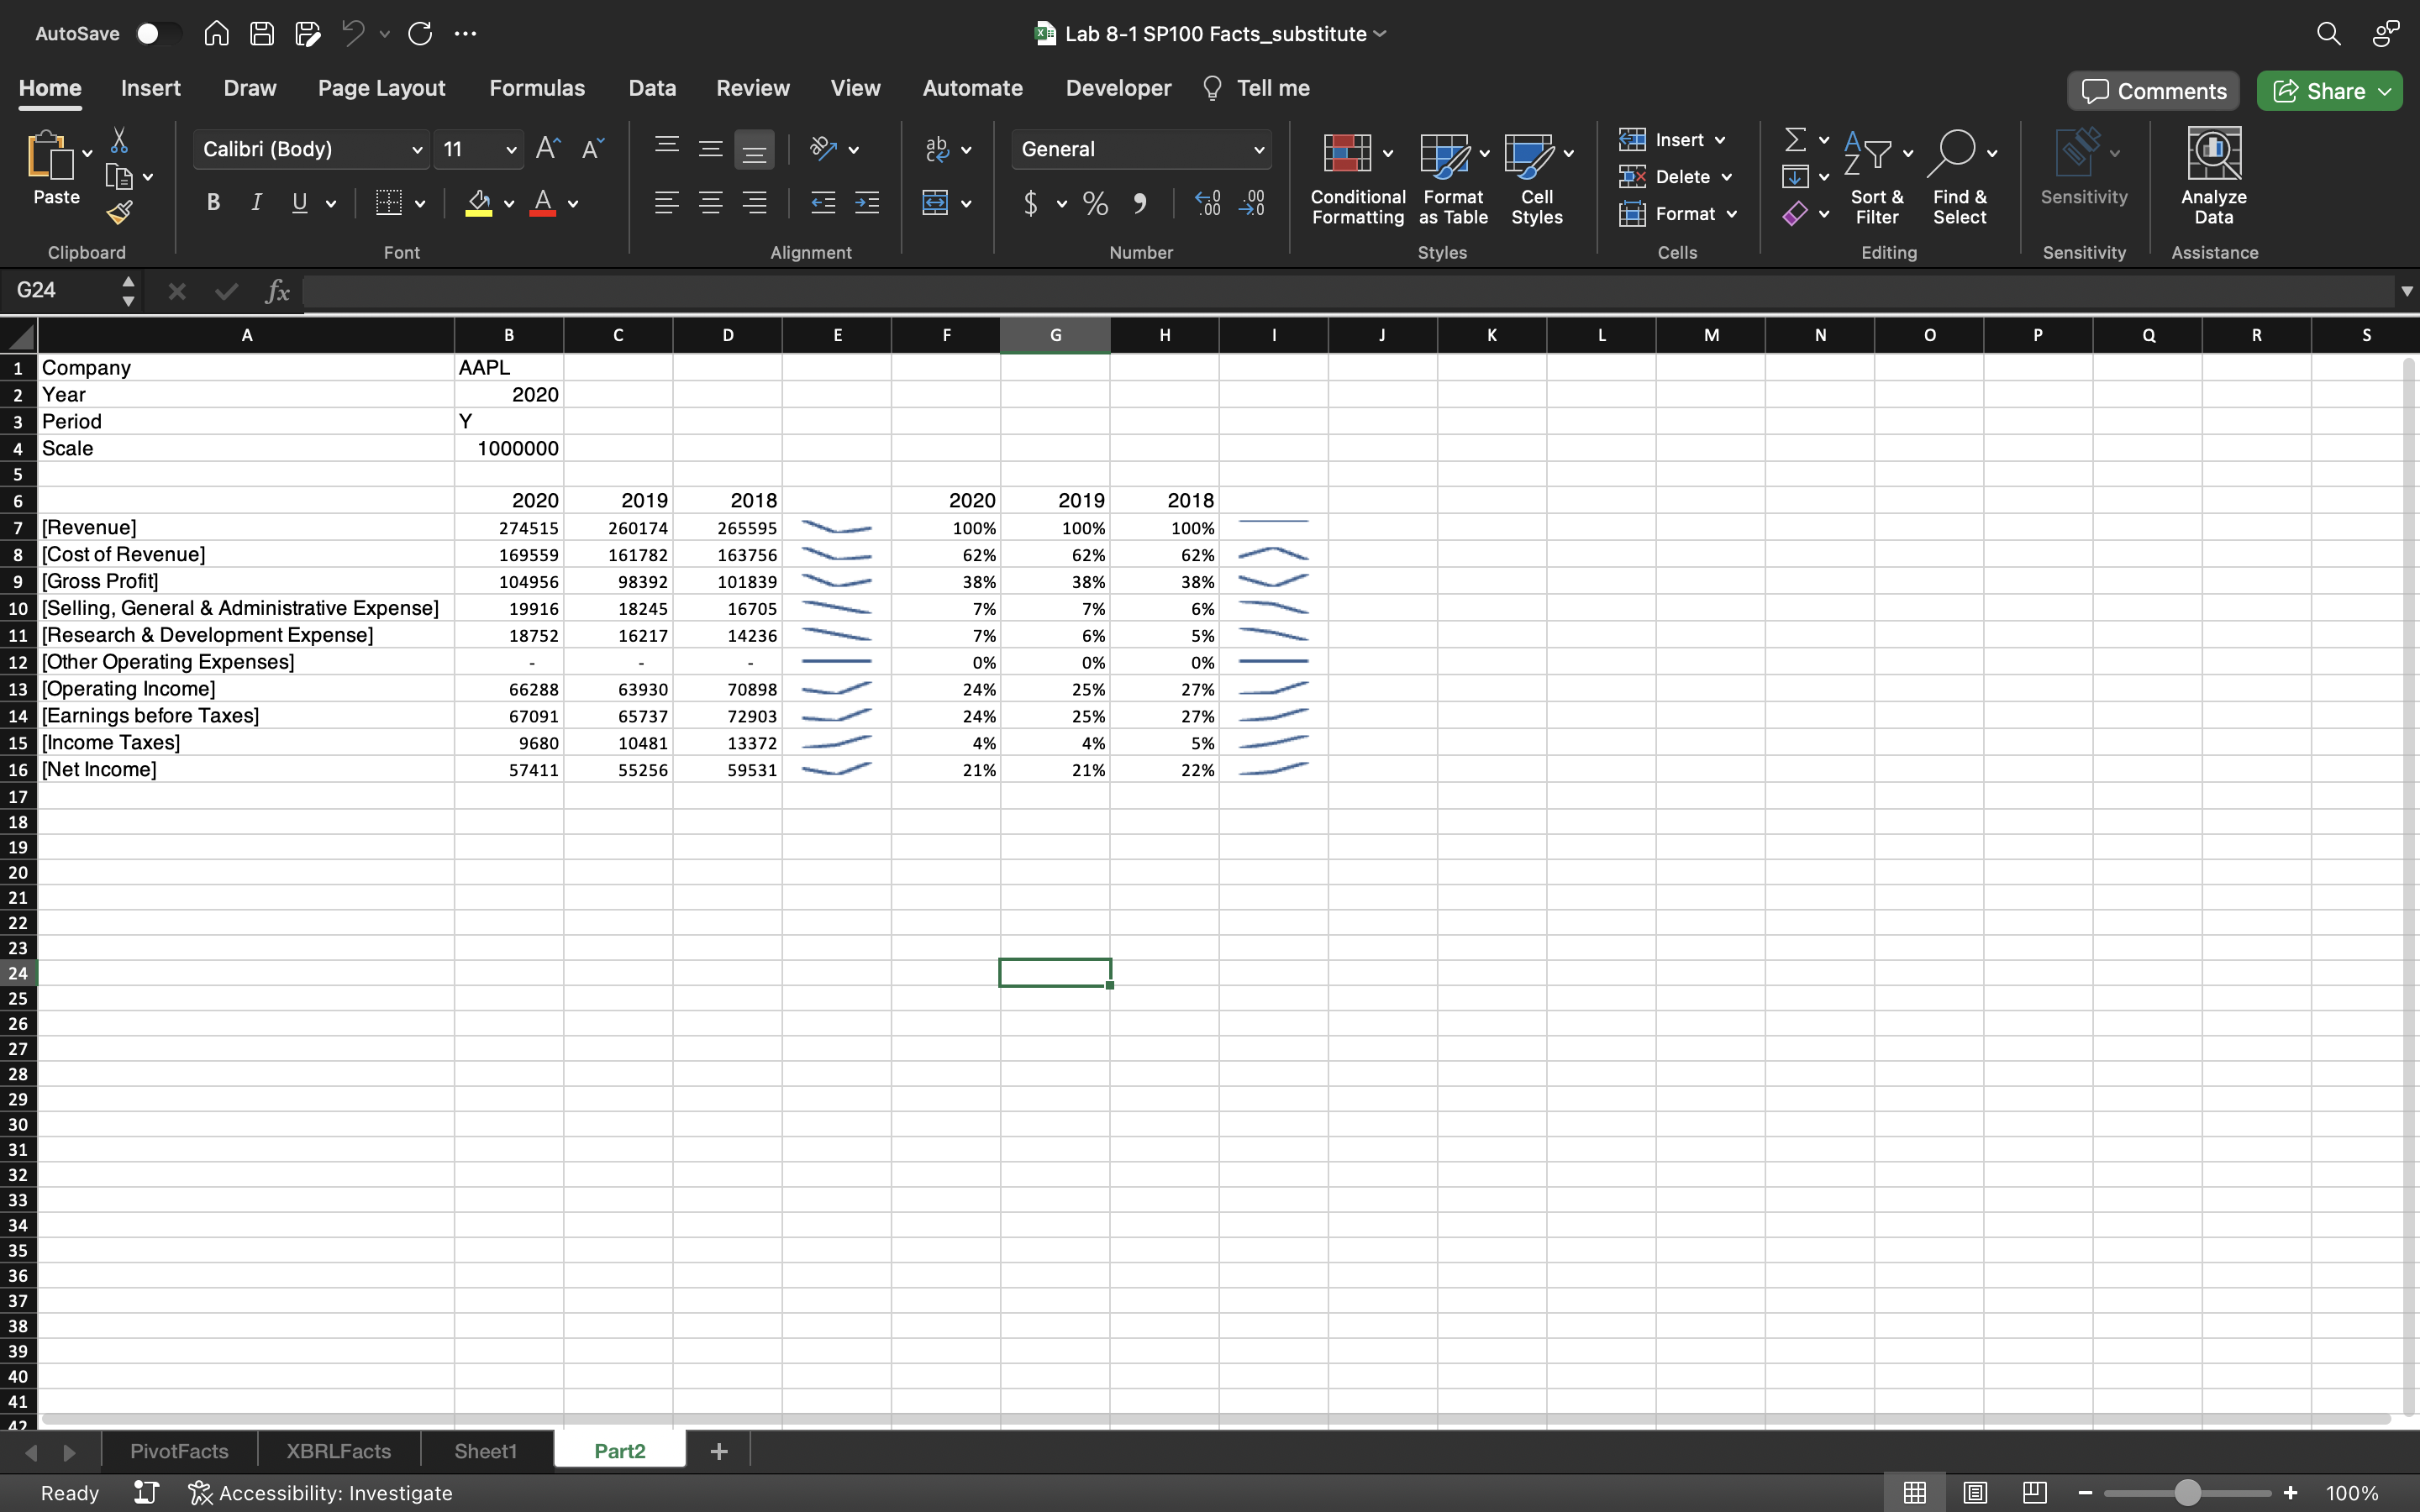
AutoSave MAGIC ... Lab 8-1 SP100 Facts_substitute Home Insert Draw Page Layout Formulas Data Review View Automate Developer PivotTable Analyze Design Tell me Comments Share Calibri (Body) 11 AA ab v General Insert v d Ex Delete Paste B A v % 9 Conditional Format Cell Sort & Find & Sensitivity Analyze Formatting as Table Styles Format v Filter Select Data Clipboard Font Alignment Number Styles Cells Editing Sensitivity Assistance B58 X V fx 59531000000 B C D E F G H K M N Sum of Value Column Labels AAPL AAPL Total ABBV ABBV Total @ ABT ABT Total @ ACN Row Labels 4 2018 2019 202 2018 2019 2020 2018 2019 202 2018 2019 Accounts Payable and Accrued Liabilities, Current] 55888000000 46236000000 42296000000 1.4442E+11 11931000000 11832000000 20159000000 43922000000 12585000000 9385000000 11687000000 33657000000 6415859000 7361899000 [Accounts Receivable, Current] 23186000000 22926000000 16120000000 62232000000 5384000000 5428000000 8822000000 19634000000 5182000000 5425000000 6414000000 17021000000 4996454000 [Additional Paid-in Capital] 0 C 0 4870764000 5804448000 [Adjustments of Non-Cash Items, CF] 16791000000 17623000000 17573000000 18405000000 794000000 5703000000 11484000000 17981000000 3755000000 3533000000 3873000000 11161000000 984517000 1005731000 [Assets] 3.65725E+11 3.38516E+11 3.238 8 8E+11 1.02813E+12 59352000000 89115000000 1.50565E+11 2.99032E+11 67173000000 67887000000 72548000000 2.07608E+11 24449083000 29789880000 37 9 [Capital Expenditures] -13313000000 -10495000000 -7309000000 -31117000000 -638000000 -552000000 -798000000 -1988000000 -1394000000 -1638000000 -2177000000 -5209000000 -619187000 -599009000 10 [Cash From Financing (CFF)] 87876000000 -90976000000 -86820000000 -2.65672E+11 -14396000000 18708000000 -11501000000 -7189000000 -10391000000 -4289000000 -2779000000 -17459000000 -3709028000 -3767171000 11 [Cash from Investing (CFI)] 16066000000 45896000000 -4289000000 57673000000 -1006000000 596000000 -37557000000 -37967000000 -1356000000 -1815000000 -2215000000 -5386000000 -1249604000 -1755576000 [Cash From Operations (CFO)] 77434000000 69391000000 80674000000 2.27499E+11 13427000000 13324000000 17588000000 44339000000 6300000000 6136000000 00000 20337000000 6026691000 6626953000 [Cash, Cash Equivalents and Short-Term Investments] 25913000000 48844000000 34940000000 1.09697E+11 7289000000 39924000000 8449000000 55662000000 3844000000 3860000000 6838000000 14542000000 5061360000 6126853000 [Changes in Accounts Receivables ] 13332000000 -3176000000 -8470000000 1686000000 591000000 74000000 929000000 1594000000 190000000 275000000 924000000 1389000000 710804000 526297000 15 [Changes in Inventories] 828000000 289000000 127000000 -412000000 226000000 231000000 40000000 497000000 514000000 593000000 493000000 1600000000 [Changes in Liabilities] 47621000000 -7248000000 6935000000 47308000000 734000000 97000000 1514000000 2345000000 533000000 -325000000 1152000000 1360000000 850857000 736628000 [Changes in Working Capital] 34694000000 3488000000 -5690000000 -36896000000 -391000000 1451000000 -106000000 954000000 148000000 1331000000 892000000 2371000000 276049000 375846000 [Common Stock] 40201000000 45174000000 50779000000 1.36154E+11 24108000000 24504000000 2264000000 50876000000 23512000000 23853000000 24145000000 71510000000 72000 72000 19 [Comprehensive Income (Loss) Attributable to Noncontrolling Interest] 6000000 6000000 0 152454000 60380000 20 [Comprehensive Income (Loss) Attributable to Parent] 56505000000 58037000000 57453000000 1.71995E+11 5934000000 6766000000 5095000000 17795000000 1176000000 2808000000 4014000000 7998000000 3578520000 4514706000 [Comprehensive Income (Loss)] 56505000000 58037000000 57453000000 1.71995E+11 5934000000 6766000000 5101000000 17801000000 -97000000 255000000 166000000 324000000 3730974000 4575086000 [Cost of Revenue] 1.63756E+11 1.61782E+11 1.69559E+11 4.95097E+11 7718000000 7439000000 15387000000 30544000000 0 12706000000 13231000000 15003000000 40940000000 28499170000 29900325000 30 Costs and Expenses] 30941000000 34462000000 38668000000 1.04071+11 26370000000 20283000000 34441000000 81094000000 26928000000 27372000000 29251 0 29251000000 83551000000 35093755000 36909939000 37 [Current Assets] 1.31339E+11 1.62819E+11 1.43713E+11 4.37871+11 16945000000 49519000000 24173000000 90637000000 14632000000 15667000000 20441000000 50740000000 13585559000 15450601000 17 [Current Liabilities] 1.15929E+11 1.05718E+11 1.05392E+11 3.27039E+11 17239000000 15585000000 28661000000 61485000000 9012000000 10863000000 11907000000 31782000000 10151751000 11061896000 12 [Depreciation (& Amortization), CF] 10903000000 11056000000 21959000000 0 0 926776000 [Depreciation (& Amortization), IS] 10903000000 25094000000 11056000000 47053000000 0 0 926776000 1785520000 [Earnings Before Taxes 72903000000 65737000000 67091000000 2.05731E+11 5197000000 8426000000 3398000000 17021000000 2873000000 4077000000 4968000000 11918000000 5808093000 6251797000 29 [Effect of Exchange Rate Changes ] C 30 [End of Period] 43372 13736 44100 131208 13465 43830 44196 131491 43465 43830 44196 131491 43343 43708 [Equity Attributable to Noncontrolling Interest] 0 0 0 0 0 0 21000000 21000000 198000000 213000000 21900000 630000000 359835000 418683000 [Equity Attributable to Parent] 1.07147E+11 90488000000 65339000000 2.62974E+11 -8446000000 -8172000000 13076000000 -3542000000 30524000000 31088000000 32784000000 94396000000 10364753000 14409008000 17 Extraordinary Items, Gain (Loss)] 0 [Goodwill] 588900000 5889000000 15663000000 15604000000 33124000000 64391000000 23254000000 23195000000 23744000000 70193000000 5383012000 6205550000 [Gross Profit] 1.01839E+11 98392000000 1.04956E+11 3.05187E+11 25035000000 25827000000 30417000000 81279000000 17872000000 18673000000 19605000000 56150000000 12493364000 13314688000 13 [Income from Continuing Operations] 59531000000 55256000000 57411000000 1.72198E+11 5687000000 7882000000 4622000000 18191000000 2334000000 3687000000 4471000000 10492000000 4214594000 4846241000 [Income from Discontinued Operations, Net of Taxes] 34000000 0 24000000 58000000 Income Taxes] 13372000000 10481000000 9680000000 33533000000 -490000000 544000000 -1224000000 -1170000000 539000000 390000000 497000000 1426000000 1593499000 1405556000 39 [Intangible Assets, Net] 2149000000 0 2149000000 21233000000 18649000000 82876000000 1.22758E+11 18942000000 17025000000 14784000000 50751000000 40 [Interest Expense] 0 0 0 -1144000000 -1509000000 -2280000000 -4933000000 826000000 670000000 546000000 2042000000 19539000 22963000 41 [Interest Paid] 3022000000 3423000000 3002000000 9447000000 1215000000 1794000000 2619000000 5628000000 845000000 $77000000 549000000 2071000000 19673000 22624000 [Inventory] 3956000000 4106000000 4061000000 12123000000 1605000000 1813000000 3310000000 6728000000 3796000000 4316000000 5012000000 13124000000 0 43 Iliabilities & Fauitvl 3 65725F+11 3 38516F+11 3.23888F+11 1 02813F+12 59352000000 89115000000 1 50565F+11 299032F+11 67173000000 67887000000 72548000000 207608F+11 24449083000 29789880000 PivotFacts XBRLFacts Sheet1 Part2 + Ready iT Accessibility: Investigate 100%AutoSave MAGIC ... Lab 8-1 SP100 Facts_substitute Home Insert Draw Page Layout Formulas Data Review View Automate Developer PivotTable Analyze Design Tell me Comments Share Calibri (Body) 11 AA ab v General Insert v d Ex Delete Paste BI Uv A - V v % 9 Conditional Format Cell Sort & Find & Sensitivity Analyze Formatting as Table Styles Format v Filter Select Data Clipboard Font Alignment Number Styles Cells Editing Sensitivity Assistance B58 X V fx 59531000000 B C D E G H M N O 43 [Liabilities & Equity] 3.65725E+11 3.38516E+11 3.23888E+11 1.02813+12 59352000000 89115000000 1.50565E+11 2.99032E+11 67173000000 67887000000 72548000000 2.07608E+11 24449083000 29789880000 3 44 [Liabilities] 2.58578E+11 2.48028E+11 2.58549E+11 7.65155E+11 67798000000 97287000000 1.37468E+11 3.02553E+11 36451000000 36586000000 39545000000 1.12582E+11 13724495000 14962189000 19 45 [Long-Term Debt, Current] 8784000000 10260000000 8773000000 27817000000 1609000000 3753000000 8468000000 1383000000 7000000 1277000000 7000000 1291000000 46 [Long-Term Investments] 1.70799E+11 1.05341E+11 1.00887E+11 3.77027E+11 1420000000 93000000 293000000 1806000000 897000000 883000000 821000000 2601000000 215532000 240313000 47 [Net Borrowing] 432000000 -7819000000 2499000000 -4888000000 3229000000 26247000000 -2683000000 26793000000 -8450000000 -1599000000 50000000 -10099000000 -4195000 4772000 48 [Net Cash, Continuing Operations] 0 12421000000 12421000000 49 [Net Cash, DO 0 50 [Net CFF, Continuing Operations] -87876000000 -90976000000 -86820000000 -2.65672E+11 -14396000000 18708000000 -11501000000 -7189000000 -10365000000 -4289000000 -2779000000 -17433000000 -3709028000 -3767171000 51 [Net CFF, DO 0 0 0 0 0 0 0 0 0 C 0 52 t CFI, Contin 16066000000 45896000000 -4289000000 57673000000 -1006000000 596000000 -37557000000 -37967000000 -1350000000 -1693000000 -2231000000 -5274000000 -1249604000 -1755576000 53 [Net CFI, DO] 54 [Net CFO, Continuing Operations] 3022000000 -3423000000 -3002000000 -9447000000 13427000000 -3241000000 -4293000000 5893000000 845000000 -677000000 -549000000 -2071000000 -1373244000 -1609897000 55 [Net CFO, DO] 0 C C 56 [Net Income Attributable to Noncontrolling Interest] 0 0 0 0 6000000 6000000 0 -328933000 -204026000 57 [Net Income Attributable to Parent] 59531000000 55256000000 57411000000 1.72198E+11 5687000000 7882000000 4616000000 18185000000 2368000000 3687000000 4495000000 10550000000 4059907000 4779112000 58 [Net Income] 59531000000 55256000000 57411000000 1.72198E+11 5687000000 7882000000 4622000000 18191000000 2368000000 3687000000 4495000000 10550000000 3730974000 4575086000 59 [Net of Property, Plant & Equipment] 41304000000 37378000000 36766000000 1.15448E+11 2883000000 2962000000 5248000000 11093000000 7563000000 8038000000 9029000000 24630000000 1264020000 1391166000 60 [Non-Interest Expense 16705000000 18245000000 19916000000 54866000000 7399000000 6942000000 11299000000 25640000000 9744000000 9765000000 9696000000 29205000000 0 61 [Non-Operating Income (Expense)] 2005000000 803000000 2808000000 0 0 0 62 [Noncurrent Assets] 2.34386E+11 1.75697E+11 1.80175E+11 5.90258E+11 42407000000 39596000000 1.26392E+11 2.08395E+11 52541000000 52220000000 52107000000 1.56868E+11 10863524000 14339279000 19: 63 [Noncurrent Liabilities 1.42649E+11 1.4231+11 1.53157E+11 4.38116E+11 49492000000 81702000000 1.08807E+11 2.40001E+11 19359000000 16661000000 18527000000 54547000000 3572744000 3900293000 64 [NonoperatingIncomeExpense 0 0 65 [Operating Expenses] 30941000000 34462000000 38668000000 1.04071E+11 26370000000 20283000000 34441000000 81094000000 26928000000 27372000000 29251000000 83551000000 35093755000 36909939000 37 66 [Operating Income] 70898000000 63930000000 66288000000 2.01116E+11 6383000000 12983000000 11363000000 30729000000 3650000000 4532000000 5357000000 13539000000 5898779000 6305074000 67 [Other CFF] 1.75427E+11 -1.64954E+11 -1.76638E+11 -5.17019E+11 -35253000000 -14549000000 -17716000000 -67518000000 -4424000000 -5976000000 -5937000000 -16337000000 -8672238000 -9127598000 68 [Other CFI] 60224000000 1.14484E+11 8355000000 1.83063E+11 -736000000 2129000000 -36645000000 -35252000000 -20000000 -259000000 -111000000 -390000000 -650614000 -1184518000 69 [Other CFO] 1956000000 57488000000 61195000000 1.16727E+11 8475000000 8681000000 5262000000 22418000000 463000000 1383000000 910000000 2756000000 2541673000 3355391000 70 [Other Comprehensive Income (Loss)] 3931000000 3419000000 1227000000 715000000 247000000 -1116000000 479000000 -390000000 -97000000 255000000 166000000 324000000 -282742000 -387409000 71 [Other Current Assets 78284000000 86943000000 85516000000 2.50743E+11 2667000000 2354000000 3592000000 8613000000 1810000000 2066000000 2177000000 6053000000 13539901000 9323748000 [Other Current Liabilities] 39293000000 43242000000 49327000000 1.31862E+11 0 -3780000000 0 -3780000000 3730555000 3693586000 [Other Noncurrent Assets 22283000000 32978000000 42522000000 97783000000 1208000000 2288000000 4851000000 8347000000 67173000000 3079000000 3729000000 73981000000 4000960000 6502250000 [Other Noncurrent Liabilities] 48914000000 50503000000 54490000000 1.53907E+11 14490000000 18727000000 31253000000 64470000000 0 0 0 2596232000 2991358000 75 [Other Operating Expenses] 0 8642000000 6934000000 16585000000 32161000000 14884000000 15167000000 17135000000 47186000000 28499170000 29900325000 30 76 [Other Operating Income] 0 -500000000 890000000 0 390000000 C 0 C 0 [Payment of Dividends 13712000000 14119000000 14081000000 41912000000 5580000000 6366000000 7716000000 19662000000 1974000000 2270000000 2560000000 6804000000 1708724000 1864353000 [Payments to Acquire Investments] 73227000000 40631000000 1.15148E+11 2.29006E+11 2528000000 1718000000 1411000000 5657000000 131000000 103000000 83000000 317000000 79 [Pension and Other Retirement Benefits] 80 [Preferred Stock Dividends and Other Adjustments] C O ooo 81 [Preferred Stock] o O O O O 0 82 [Proceeds from Investments] 1.04072E+11 98724000000 1.20483E+11 3.23279E+11 2160000000 2699000000 1525000000 6384000000 73000000 21000000 10000000 104000000 83 [Proceeds from Sale of Equity] 669000000 781000000 880000000 2330000000 73000000 8000000 209000000 290000000 271000000 298000000 245000000 814000000 753146000 848445000 84 [Provision For Doubtful Accounts] 0 0 0 0 0 0 0 0 DivotFacts XBRLFacts Sheet1 Part2 + In Ready mode Ready iT Accessibility: Investigate 100%AutoSave MAGIC ... Lab 8-1 SP100 Facts_substitute Home Insert Draw Page Layout Formulas Data Review View Automate Developer PivotTable Analyze Design Tell me Comments Share Calibri (Body) Insert v 11 AA 15 v General 2 Ex Delete Paste BI UV A - V v % 9 Conditional Format Cell Sort & Find & Sensitivity Analyze Formatting as Table Styles Format v Filter Select Data Clipboard Font Alignment Number Styles Cells Editing Sensitivity Assistance B58 X V fx 59531000000 B C D E G H K M N 71 [Other Current Assets] 78284000000 86943000000 85516000000 2.50743E+11 2667000000 2354000000 3592000000 8613000000 1810000000 2066000000 2177000000 6053000000 13539901000 9323748000 [Other Current Liabilities] 39293000000 43242000000 49327000000 1.31862E+11 0 -3780000000 0 0 -3780000000 3730555000 3693586000 73 [Other Noncurrent Assets] 22283000000 32978000000 42522000000 97783000000 1208000000 2288000000 4851000000 8347000000 67173000000 3079000000 3729000000 73981000000 4000960000 6502250000 [Other Noncurrent Liabilities] 48914000000 50503000000 54490000000 1.53907E+11 14490000000 18727000000 31253000000 64470000000 0 2596232000 2991358000 75 [Other Operating Expenses] 0 8642000000 6934000000 16585000000 32161000000 14884000000 15167000000 17135000000 47186000000 28499170000 29900325000 30 76 [Other Operating Income] -500000000 890000000 390000000 0 [Payment of Dividends 13712000000 14119000000 14081000000 41912000000 5580000000 6366000000 7716000000 19662000000 1974000000 2270000000 2560000000 6804000000 1708724000 1864353000 78 [Payments to Acquire Investments] 73227000000 40631000000 1.15148E+11 2.29006E+11 2528000000 1718000000 1411000000 5657000000 131000000 103000000 83000000 317000000 [Pension and Other Retirement Benefits] O o 80 [Preferred Stock Dividends and Other Adjustments] 0 0 0 O O O o O 81 [Preferred Stock] O O o O 0 O 82 [Proceeds from Investments] 1.04072E+11 98724000000 1.20483E+11 3.23279E+11 2160000000 2699000000 1525000000 6384000000 73000000 21000000 10000000 104000000 83 [Proceeds from Sale of Equity] 569000000 781000000 880000000 2330000000 73000000 8000000 209000000 290000000 271000000 298000000 245000000 814000000 753146000 848445000 84 [Provision For Doubtful Accounts] 85 [Repurchase of Equity] 72738000000 66897000000 72358000000 2.11993E+11 12014000000 629000000 978000000 13621000000 238000000 718000000 403000000 1359000000 2639094000 2691114000 86 [Research & Development Expense] 14236000000 16217000000 18752000000 49205000000 10329000000 6407000000 6557000000 23293000000 2300000000 2440000000 242000000 7160000000 C 87 [Retained Earnings (Accumulated Deficit)] 70400000000 45898000000 14966000000 1.31264E+11 3368000000 4717000000 1055000000 9140000000 24560000000 25847000000 27627000000 78034000000 7952413000 10421538000 12 88 [Revenue] 2.65595E+11 2.60174E+11 2.74515E+11 8.00284E+11 32753000000 33266000000 45804000000 1.11823E+11 30578000000 31904000000 34608000000 97090000000 40992534000 43215013000 44 89 [Selling, General & Administrative Expense] 16705000000 18245000000 19916000000 54866000000 7399000000 6942000000 11299000000 25640000000 9744000000 9765000000 9696000000 29205000000 6594585000 7009614000 90 [Short-Term Borrowing] 11964000000 5980000000 4996000000 22940000000 3699000000 $4000000 3733000000 200000000 201000000 213000000 514000000 91 [Short-Term Investments] 40388000000 51713000000 52927000000 1.45028E+11 772000000 30000000 802000000 242000000 280000000 31000000 832000000 3192000 331300 92 [Stock-Based Compensation] $340000000 6068000000 6829000000 18237000000 421000000 430000000 753000000 1604000000 477000000 519000000 546000000 1542000000 976908000 1093253000 93 [Stockholders' Equity] 1.07147E+11 65339000000 1.72486E+11 -8446000000 13076000000 4630000000 30524000000 32784000000 63308000000 10364753000 94 [StockholdersEquity 95 [Total Cash, Change] 5624000000 24311000000 -10435000000 19500000000 -2014000000 32635000000 -31475000000 -854000000 -5447000000 32000000 2907000000 -2508000000 1065493000 96 Grand Total 3.71539E+12 3.56254E+12 3.47447+12 1.07524E+13 6.13138E+11 9.22596E+11 1.06886E+12 2.6046E+12 6.56902E+11 6.02868E+11 6.90431E+11 1.9502E+12 4.00397E+11 4.26519E+11 98 99 100 110 PivotFacts XBRLFacts Sheet1 Part2 + Ready iT Accessibility: Investigate 100%AutoSave MAP ? C ... Lab 8-1 SP100 Facts_substitute Home Insert Draw Page Layout Formulas Data Review View Automate Developer ? Tell me Comments Share Calibri (Body) 11 AA ab v General Insert v d x Delete Sort & Analyze Paste BI Uv A Find & = F V v % 9 Conditional Format Cell Sensitivity Formatting as Table Styles Format v DV Filter Select Data Clipboard Font Alignment Number Styles Cells Editing Sensitivity Assistance G24 X V fx A B C D E F G H K M N P Q R S Company AAPL Year 2020 Period Scale 1000000 2020 2019 2018 2020 2019 2018 [Revenue] 274515 260174 265595 100% 100% 100% [Cost of Revenue] 169559 161782 163756 62% 62% 62% Gross Profit] 10495 9839 101839 38% 38% 38% 10 [Selling, General & Administrative Expense] 19916 18245 16705 7% 7% 6% 11 [Research & Development Expense] 18752 16217 14236 7% 5% 5% 12 [Other Operating Expenses] 0% 0% 13 [Operating Income] 66288 63930 86802 24% 25% 27% 14 [Earnings before Taxes] 57091 6573 72903 24% 25% 27% 15 [Income Taxes] 9680 1048 13372 4% 4% 5% [Net Income] 57411 55256 59531 21% 21% 22% PivotFacts XBRLFacts Sheet1 Part2 + Ready Accessibility: Investigate 100%