

Question: AutoSave O Off) Document2 - Word Brandy Majewski BM X Search File Home Insert Draw Design Layout References Mailings Review View Help Grammarly Share Comments
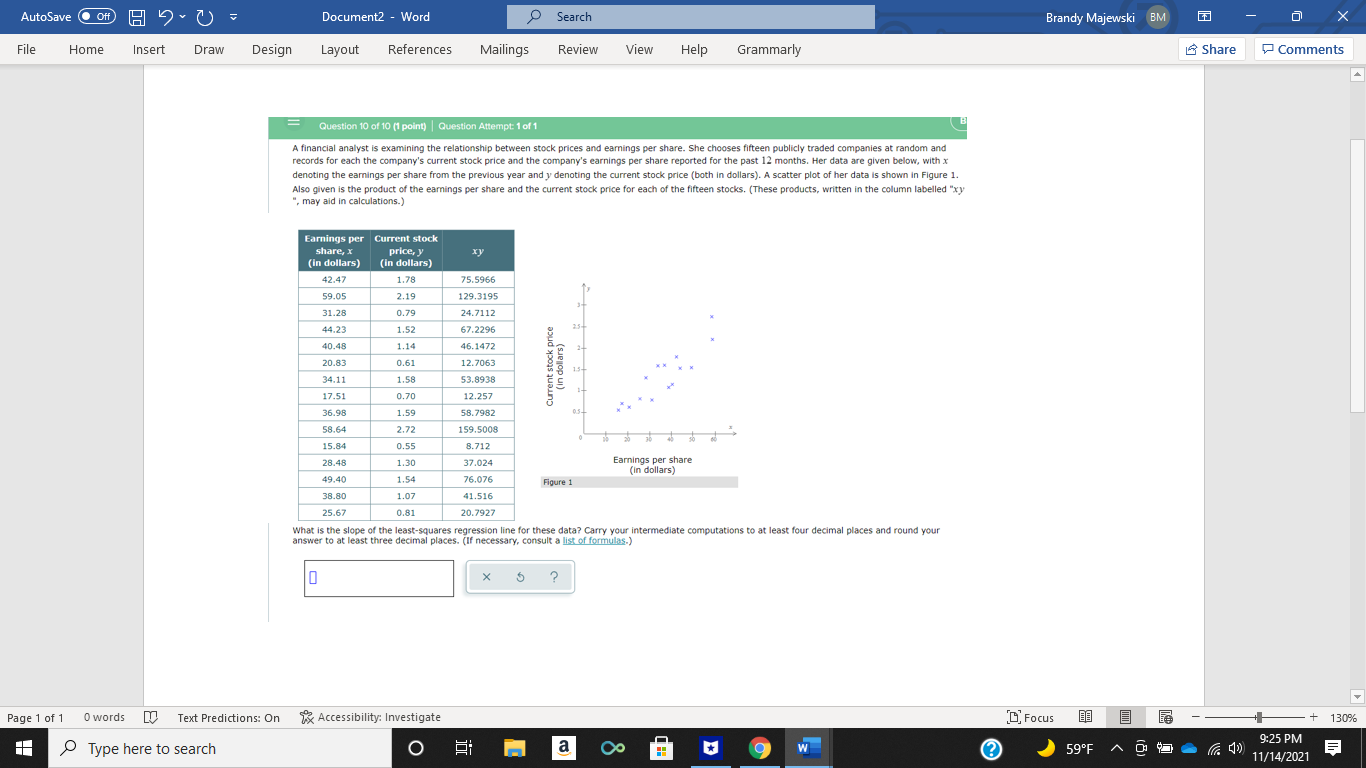

AutoSave O Off) Document2 - Word Brandy Majewski BM X Search File Home Insert Draw Design Layout References Mailings Review View Help Grammarly Share Comments Question 10 of 10 (1 point) | Question Attempt: 1 of 1 A financial analyst is examining the relationship between stock prices and earnings per share. She chooses fifteen publicly traded companies at random and records for each the company's current stock price and the company's earnings per share reported for the past 12 months. Her data are given below, with x denoting the earnings per share from the previous year and y denoting the current stock price (both in dollars). A scatter plot of her data is shown in Figure 1. Also given is the product of the earnings per share and the current stock price for each of the fifteen stocks. (These products, written in the column labelled "xy ", may aid in calculations.) Earnings per Current stock share, X price, y xy (in dollars) (in dollars) 42.47 1.78 75.5966 59.05 2.19 129.3195 Y 31.28 0.79 24.7112 44.23 1.52 67.2296 35+ 40.48 1.14 46.1472 20.83 0.61 12.7063 Current stock price ( in dollars) 15- 34.11 1.58 53.8938 17.51 0.70 12.257 36.98 1.59 58.7982 58.64 2.72 159.5008 15.84 0.55 B.712 28.48 1.30 37.024 Earnings per share (in dollars) 49.40 1.54 76.076 Figure 1 38.80 1.07 41.516 25.67 0.81 20.7927 What is the slope of the least-squares regression line for these data? Carry your intermediate computations to at least four decimal places and round your answer to at least three decimal places. (If necessary, consult a list of formulas.) X 5 ? 1% Accessibility: Investigate [ Focus + 130% Page 1 of 1 0words [ Text Predictions: On 9:25 PM Type here to search O a Co 9 W ? 59 F ~ 9 3 - (1)) 11/14/2021
Step by Step Solution
There are 3 Steps involved in it

Get step-by-step solutions from verified subject matter experts