

Question: AutoSave O Off ) Fishbone. Template - Excel Search A Martin, Marquez MM X File Home Insert Draw Page Layout Formulas Data Review View Help
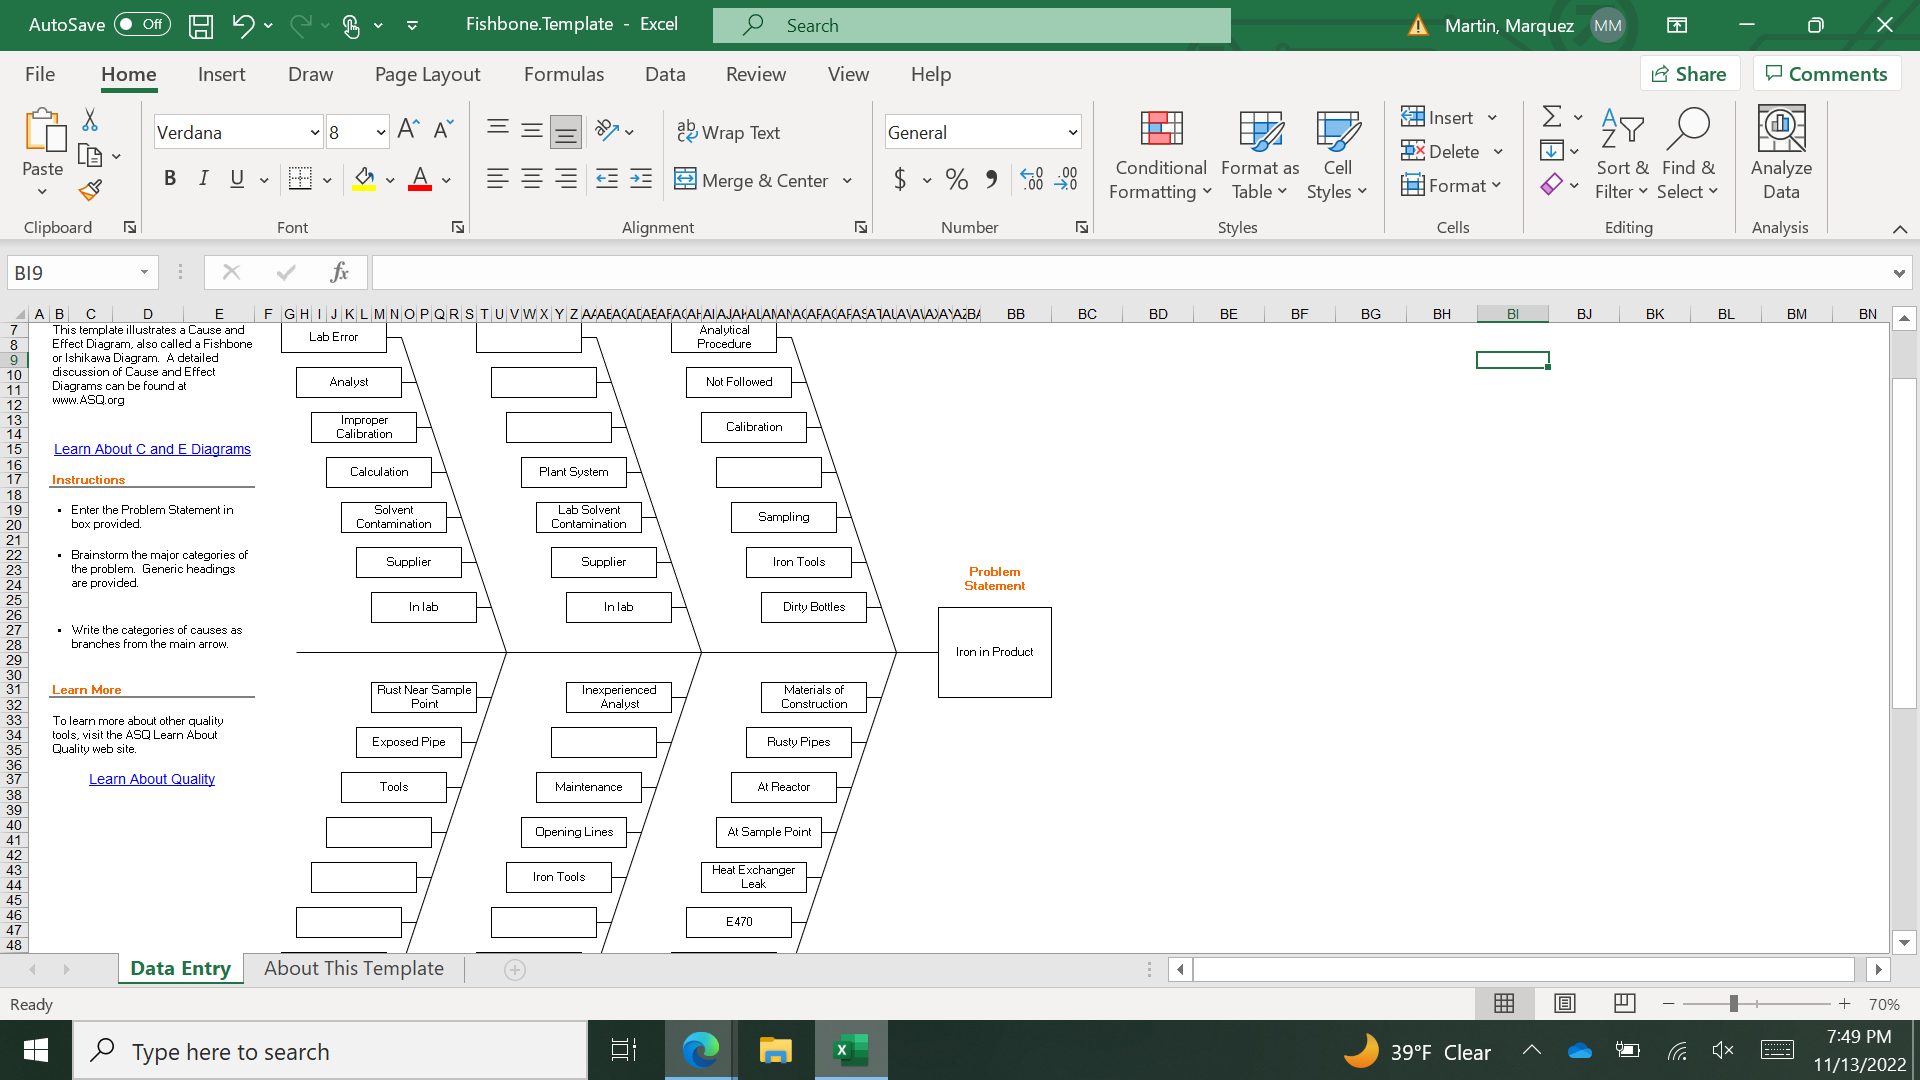
AutoSave O Off ) Fishbone. Template - Excel Search A Martin, Marquez MM X File Home Insert Draw Page Layout Formulas Data Review View Help Share Comments Insert Verdana 8 AA al Wrap Text General Ex AY O Ex Delete Paste E Merge & Center $ ~ % 9 08 20 Conditional Format as Cell Sort & Find & Analyze Formatting Table ~ Styles v Format Filter ~ Select v Data Clipboard Font Alignment Number Styles Cells Editing Analysis B19 X V ABC D E F G HI JKLMNOP QRS TUVWX Y Z A/AEACALAEAFACAI AI AJAHALANANACAFACAFASATALA AVA)A AZBA BB BC BD BE BF BG BH BI BJ BK BL BM BN This template illustrates a Cause and Lab Error Analytical Effect Diagram, also called a Fishbone Procedure or Ishikawa Diagram. A detailed 10 discussion of Cause and Effect 11 Diagrams can be found at Analyst Not Followed WWW.ASQ.org Improper Calibration Calibration Learn About C and E Diagrams Calculation Instructions Plant System . Enter the Problem Statement in Solvent Lab Solvent 20 box provided. Contamination Contamination Sampling . Brainstorm the major categories of the problem. Generic headings Supplier Supplier Iron Tools Problem are provided. Statement In lab In lab Dirty Bottles . Write the categories of causes as branches from the main arrow. 29 Iron in Product Learn More Rust Near Sample Inexperienced Materials of Point Analyst Construction To learn more about other quality tools, visit the ASQ Learn About 35 Quality web site. Exposed Pipe Rusty Pipes Learn About Quality 38 Tools Maintenance At Reactor 39 40 41 Opening Lines At Sample Point 42 43 Iron Tools Heat Exchanger 44 Leak 45 46 47 E 470 48 Data Entry About This Template (+ Ready - - + 70% Type here to search X 7:49 PM 39.F Clear X 11/13/2022
Step by Step Solution
There are 3 Steps involved in it

Get step-by-step solutions from verified subject matter experts