

Question: AutoSave ( off 245final_data LO - O X File Home Insert Draw Page Layout Formulas Data Review View Help e. What is the proportion of
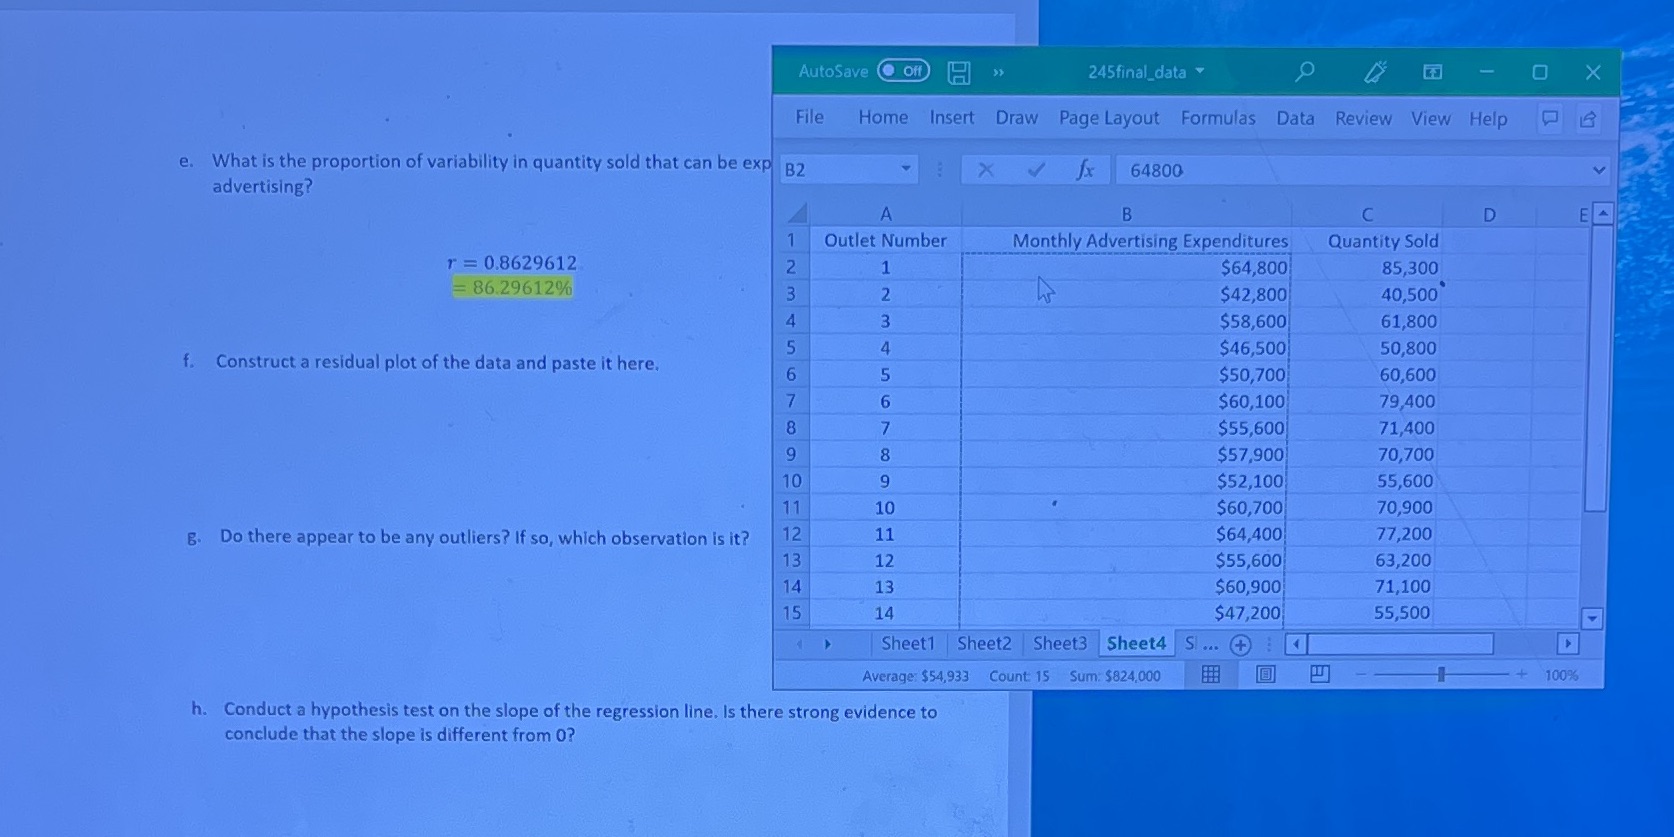
AutoSave ( off 245final_data LO - O X File Home Insert Draw Page Layout Formulas Data Review View Help e. What is the proportion of variability in quantity sold that can be exp B2 X - fx 64800 advertising? A B C D E 4 Outlet Number Monthly Advertising Expenditures Quantity Sold 7 = 0.8629612 WN - $64,800 85,300 86.29612% $42,800 40,500 $58,600 61,800 $46,500 50,800 f. Construct a residual plot of the data and paste it here. $50,700 60,600 $60,100 79,400 $55,600 71,400 $57,900 70,700 10 $52,100 55,600 11 10 $60,700 70,900 g. Do there appear to be any outliers? If so, which observation is it? IN 11 $64,400 77,200 13 12 $55,600 63,200 14 13 $60,900 71,100 15 14 $47,200 55,500 Sheet1 Sheet2 Sheet3 Sheet4 S ... + 4 Average: $54,933 Count: 15 Sum: $824,000 + 100% h. Conduct a hypothesis test on the slope of the regression line. Is there strong evidence to conclude that the slope is different from 0
Step by Step Solution
There are 3 Steps involved in it

Get step-by-step solutions from verified subject matter experts