

Question: AutoSave . OFF AA ?CG ... 3 e6 - Saved to my Mac Home Insert Draw Design Layout References Mailings Review View Tell me Share
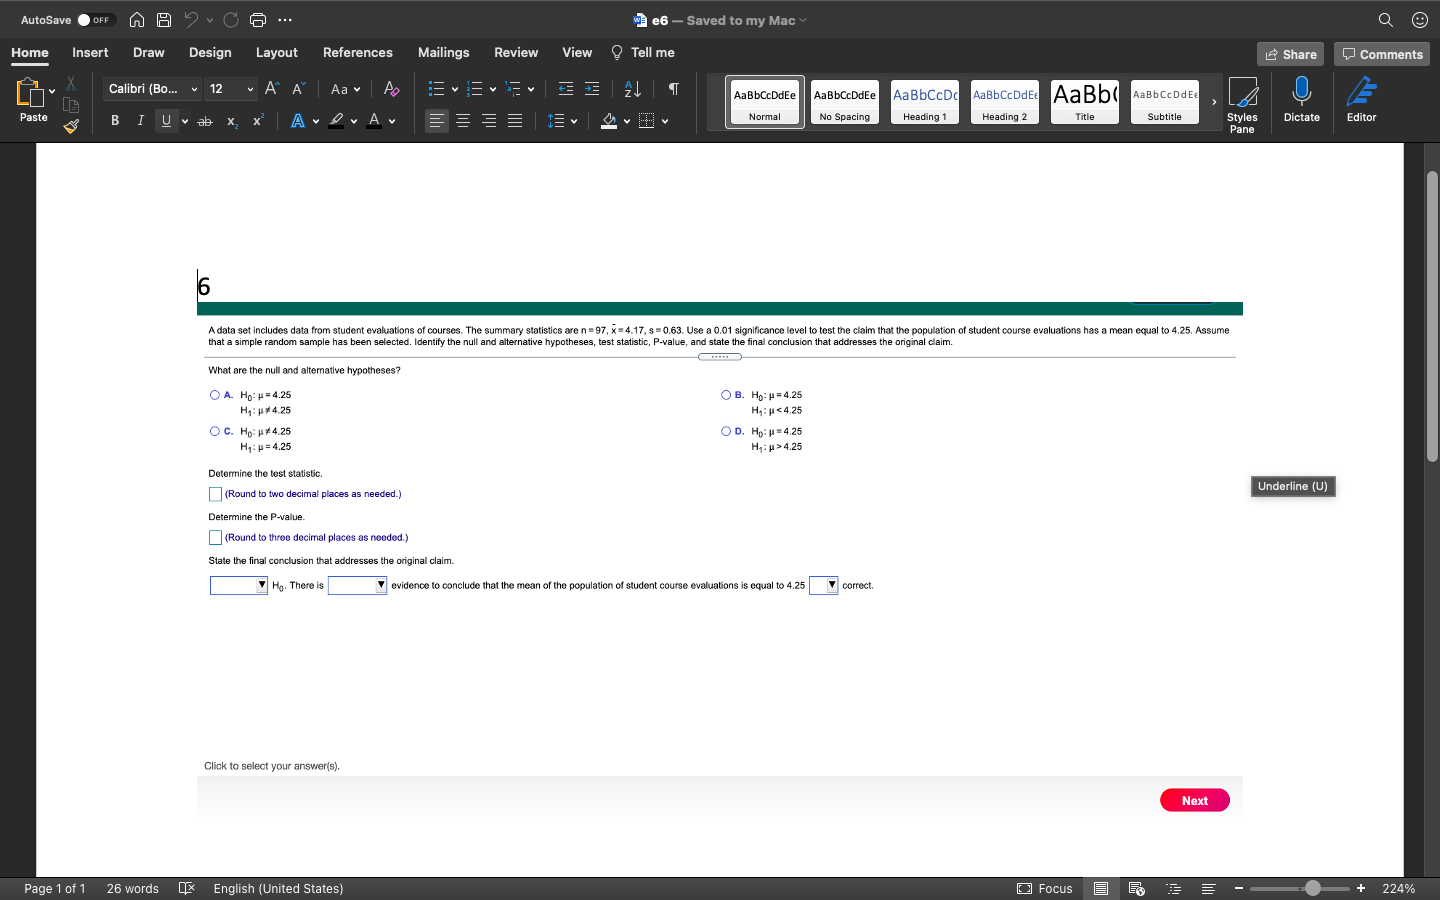
AutoSave . OFF AA ?CG ... 3 e6 - Saved to my Mac Home Insert Draw Design Layout References Mailings Review View Tell me Share Comments Calibri (BO.. 12 Aa v AaBbCcDdEe AaBbCcDdEe AaBbCcD AaBbCcDdEE AaBb AaBbCcDdEe Paste B I A A v Normal No Spacing Heading 1 Heading 2 Title Subtitle Styles Dictate Editor Pane 6 A data set includes data from student evaluations of courses. The summary statistics are n = 97, x= 4.17, s= 0.63. Use a 0.01 significance level to test the claim that the population of student course evaluations has a mean equal to 4.25. Assume that a simple random sample has been selected. Identify the null and alternative hypotheses, test statistic, P-value, and state the final conclusion that addresses the original claim. What are the null and alternative hypotheses? O A. Ho: H = 4.25 O B. Ho: H = 4.25 Hy: HW 4.25 Hy: 14 4.25 Determine the test statistic. (Round to two decimal places as needed.) Underline (U) Determine the P-value. (Round to three decimal places as needed.) State the final conclusion that addresses the original claim. Ho. There is evidence to conclude that the mean of the population of student course evaluations is equal to 4.25 correct. Click to select your answer(s). Next Page 1 of 1 26 words English (United States) Focus E 224%
Step by Step Solution
There are 3 Steps involved in it

Get step-by-step solutions from verified subject matter experts