Question: AutoSave OFF AAA2G ... Excel Analytics 1-21 Home Insert Draw Page Layout Formulas Data Review View Analytic Solver Data Mining Tell me Le Share Comments
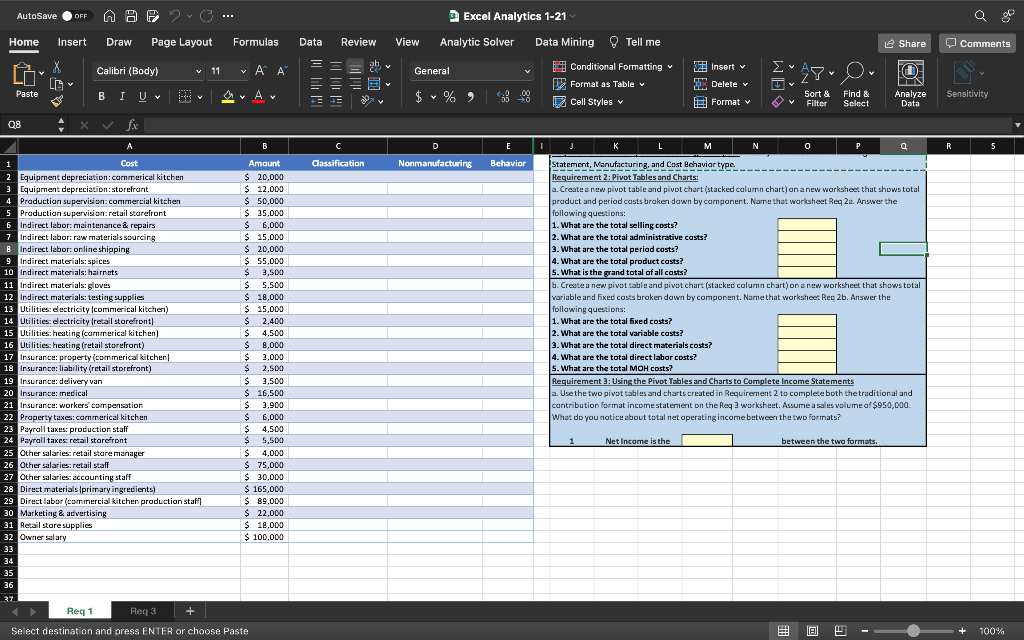
AutoSave OFF AAA2G ... Excel Analytics 1-21 Home Insert Draw Page Layout Formulas Data Review View Analytic Solver Data Mining Tell me Le Share Comments Calibri (Body) v 11 v General Insert v = at {"28" O F Conditional Formatting v Format as Table Cell Styles CS LL * Paste BI U ar Ar A DX Delete v B! Format v 1 $ %) Sensitivity Sort & Filter Find & Select Analyze Data V 08 xv fx B D E I L M N 0 P a R 5 Classification Nonmanufacturing Behavior 1 Cost 2 Equipment depreciation commerical kitchen Equipment depreciation storefront 4 Production supervision commercial kitchen 5 Production supervision: retail storefront 6 Indirect labor: maintenance & repairs Indirect labor: raw materials sourcing 8 Indirect labor: online shipping 9 Indirect materials: spices 10 Indirect materials: hairnets 11 Indirect materials: gloves 12 Indirect materials: testing supplies 13 Utilities: electricity Icommerical kitchen) 14 Utilities: electricity retail storefront 15 Utilities: heating commerical kitchen 16 Utilities: heating (retail storefront) 17 Insurance property (commerical kitchen 18 Insurance liability (retail storefrant) 19 Insurance delivery van 20 Insurance medical 21 Insurance workers' compensation 22 Property taxes: commerical kitchen 23 Payroll taxes production staff 24 Payrall taxes retail storefront 25 Other salaries: retail store manager 26 Other salaries: retail stall 27 Other salaries accounting staff 28 Direct materials primary ingredients) 29 Direct labor (commercial kitchen production staff) 30 Marketing & advertising 31 Retail store supplies 32 Owner salary 33 34 35 36 Amount $ 20.000 $ 12.000 $ 50,000 $ 35,000 $ 6,000 $ 15,000 $ 20,000 $ 55,000 $ 2,500 $ 5,500 $ 18,000 $ 15,000 $ 2,400 $ 4.500 $ 8.000 $ 3.000 $ 2,500 $ 3.500 $ 16,500 $ 2,900 $ $ 6,000 $ 4.500 $ 5,500 $ 4,000 $ 75,000 $ 30,000 $ 165,000 $ 89.000 $ 22.000 $ 18.000 $ 100,000 Statement, Manufacturing and Cost Behaviar type Requirement 2: Pivot Tables and Charts: a. Create a new pivot table and pivot chart (stacked calumn chart) on a new worksheet that shows total product and period casts broken down by component. Name that worksheet Reg 2a. Answer the following questions: 1. What are the total selling costs? 2. What are the total administrative costs? 3. What are the total period costs? 4. What are the total product costs? s. What is the grand total of all costs? b. Create a new pivot table and pivot chart (stacked column chart) on a new worksheet that shows total variable and fixed costs broken down by component. Name that worksheet Reg 2b. Answer the following questions: 1. What are the total fixed costs? 2. What are the total variable costs? 3. What are the total direct materials costs? 4. What are the total direct labor costs? s. What are the total MOH costs? Requirement 3: Using the Pivot Tables and Charts to Complete Income Statements a. Use the two pivot tables and charts created in Requirement to complete both the traditional and contribution format income statement on the Req 3 worksheet. Assume a sales volume af$950,000. What do you notice about total net operating income between the two formats? 1 Net Income is the between the two formats. 37 Reg 3 + Req1 Select destination and press ENTER or choose Paste 1B 100% AutoSave OFF AAA2G ... Excel Analytics 1-21 Home Insert Draw Page Layout Formulas Data Review View Analytic Solver Data Mining Tell me Le Share Comments Calibri (Body) v 11 v General Insert v = at {"28" O F Conditional Formatting v Format as Table Cell Styles CS LL * Paste BI U ar Ar A DX Delete v B! Format v 1 $ %) Sensitivity Sort & Filter Find & Select Analyze Data V 08 xv fx B D E I L M N 0 P a R 5 Classification Nonmanufacturing Behavior 1 Cost 2 Equipment depreciation commerical kitchen Equipment depreciation storefront 4 Production supervision commercial kitchen 5 Production supervision: retail storefront 6 Indirect labor: maintenance & repairs Indirect labor: raw materials sourcing 8 Indirect labor: online shipping 9 Indirect materials: spices 10 Indirect materials: hairnets 11 Indirect materials: gloves 12 Indirect materials: testing supplies 13 Utilities: electricity Icommerical kitchen) 14 Utilities: electricity retail storefront 15 Utilities: heating commerical kitchen 16 Utilities: heating (retail storefront) 17 Insurance property (commerical kitchen 18 Insurance liability (retail storefrant) 19 Insurance delivery van 20 Insurance medical 21 Insurance workers' compensation 22 Property taxes: commerical kitchen 23 Payroll taxes production staff 24 Payrall taxes retail storefront 25 Other salaries: retail store manager 26 Other salaries: retail stall 27 Other salaries accounting staff 28 Direct materials primary ingredients) 29 Direct labor (commercial kitchen production staff) 30 Marketing & advertising 31 Retail store supplies 32 Owner salary 33 34 35 36 Amount $ 20.000 $ 12.000 $ 50,000 $ 35,000 $ 6,000 $ 15,000 $ 20,000 $ 55,000 $ 2,500 $ 5,500 $ 18,000 $ 15,000 $ 2,400 $ 4.500 $ 8.000 $ 3.000 $ 2,500 $ 3.500 $ 16,500 $ 2,900 $ $ 6,000 $ 4.500 $ 5,500 $ 4,000 $ 75,000 $ 30,000 $ 165,000 $ 89.000 $ 22.000 $ 18.000 $ 100,000 Statement, Manufacturing and Cost Behaviar type Requirement 2: Pivot Tables and Charts: a. Create a new pivot table and pivot chart (stacked calumn chart) on a new worksheet that shows total product and period casts broken down by component. Name that worksheet Reg 2a. Answer the following questions: 1. What are the total selling costs? 2. What are the total administrative costs? 3. What are the total period costs? 4. What are the total product costs? s. What is the grand total of all costs? b. Create a new pivot table and pivot chart (stacked column chart) on a new worksheet that shows total variable and fixed costs broken down by component. Name that worksheet Reg 2b. Answer the following questions: 1. What are the total fixed costs? 2. What are the total variable costs? 3. What are the total direct materials costs? 4. What are the total direct labor costs? s. What are the total MOH costs? Requirement 3: Using the Pivot Tables and Charts to Complete Income Statements a. Use the two pivot tables and charts created in Requirement to complete both the traditional and contribution format income statement on the Req 3 worksheet. Assume a sales volume af$950,000. What do you notice about total net operating income between the two formats? 1 Net Income is the between the two formats. 37 Reg 3 + Req1 Select destination and press ENTER or choose Paste 1B 100%


