Question: AutoSave OFF MAP ? CE ABC ... FIN 320 Project Two Financial Formulas Home Insert Draw Page Layout Formulas Data Review View Tell me Share
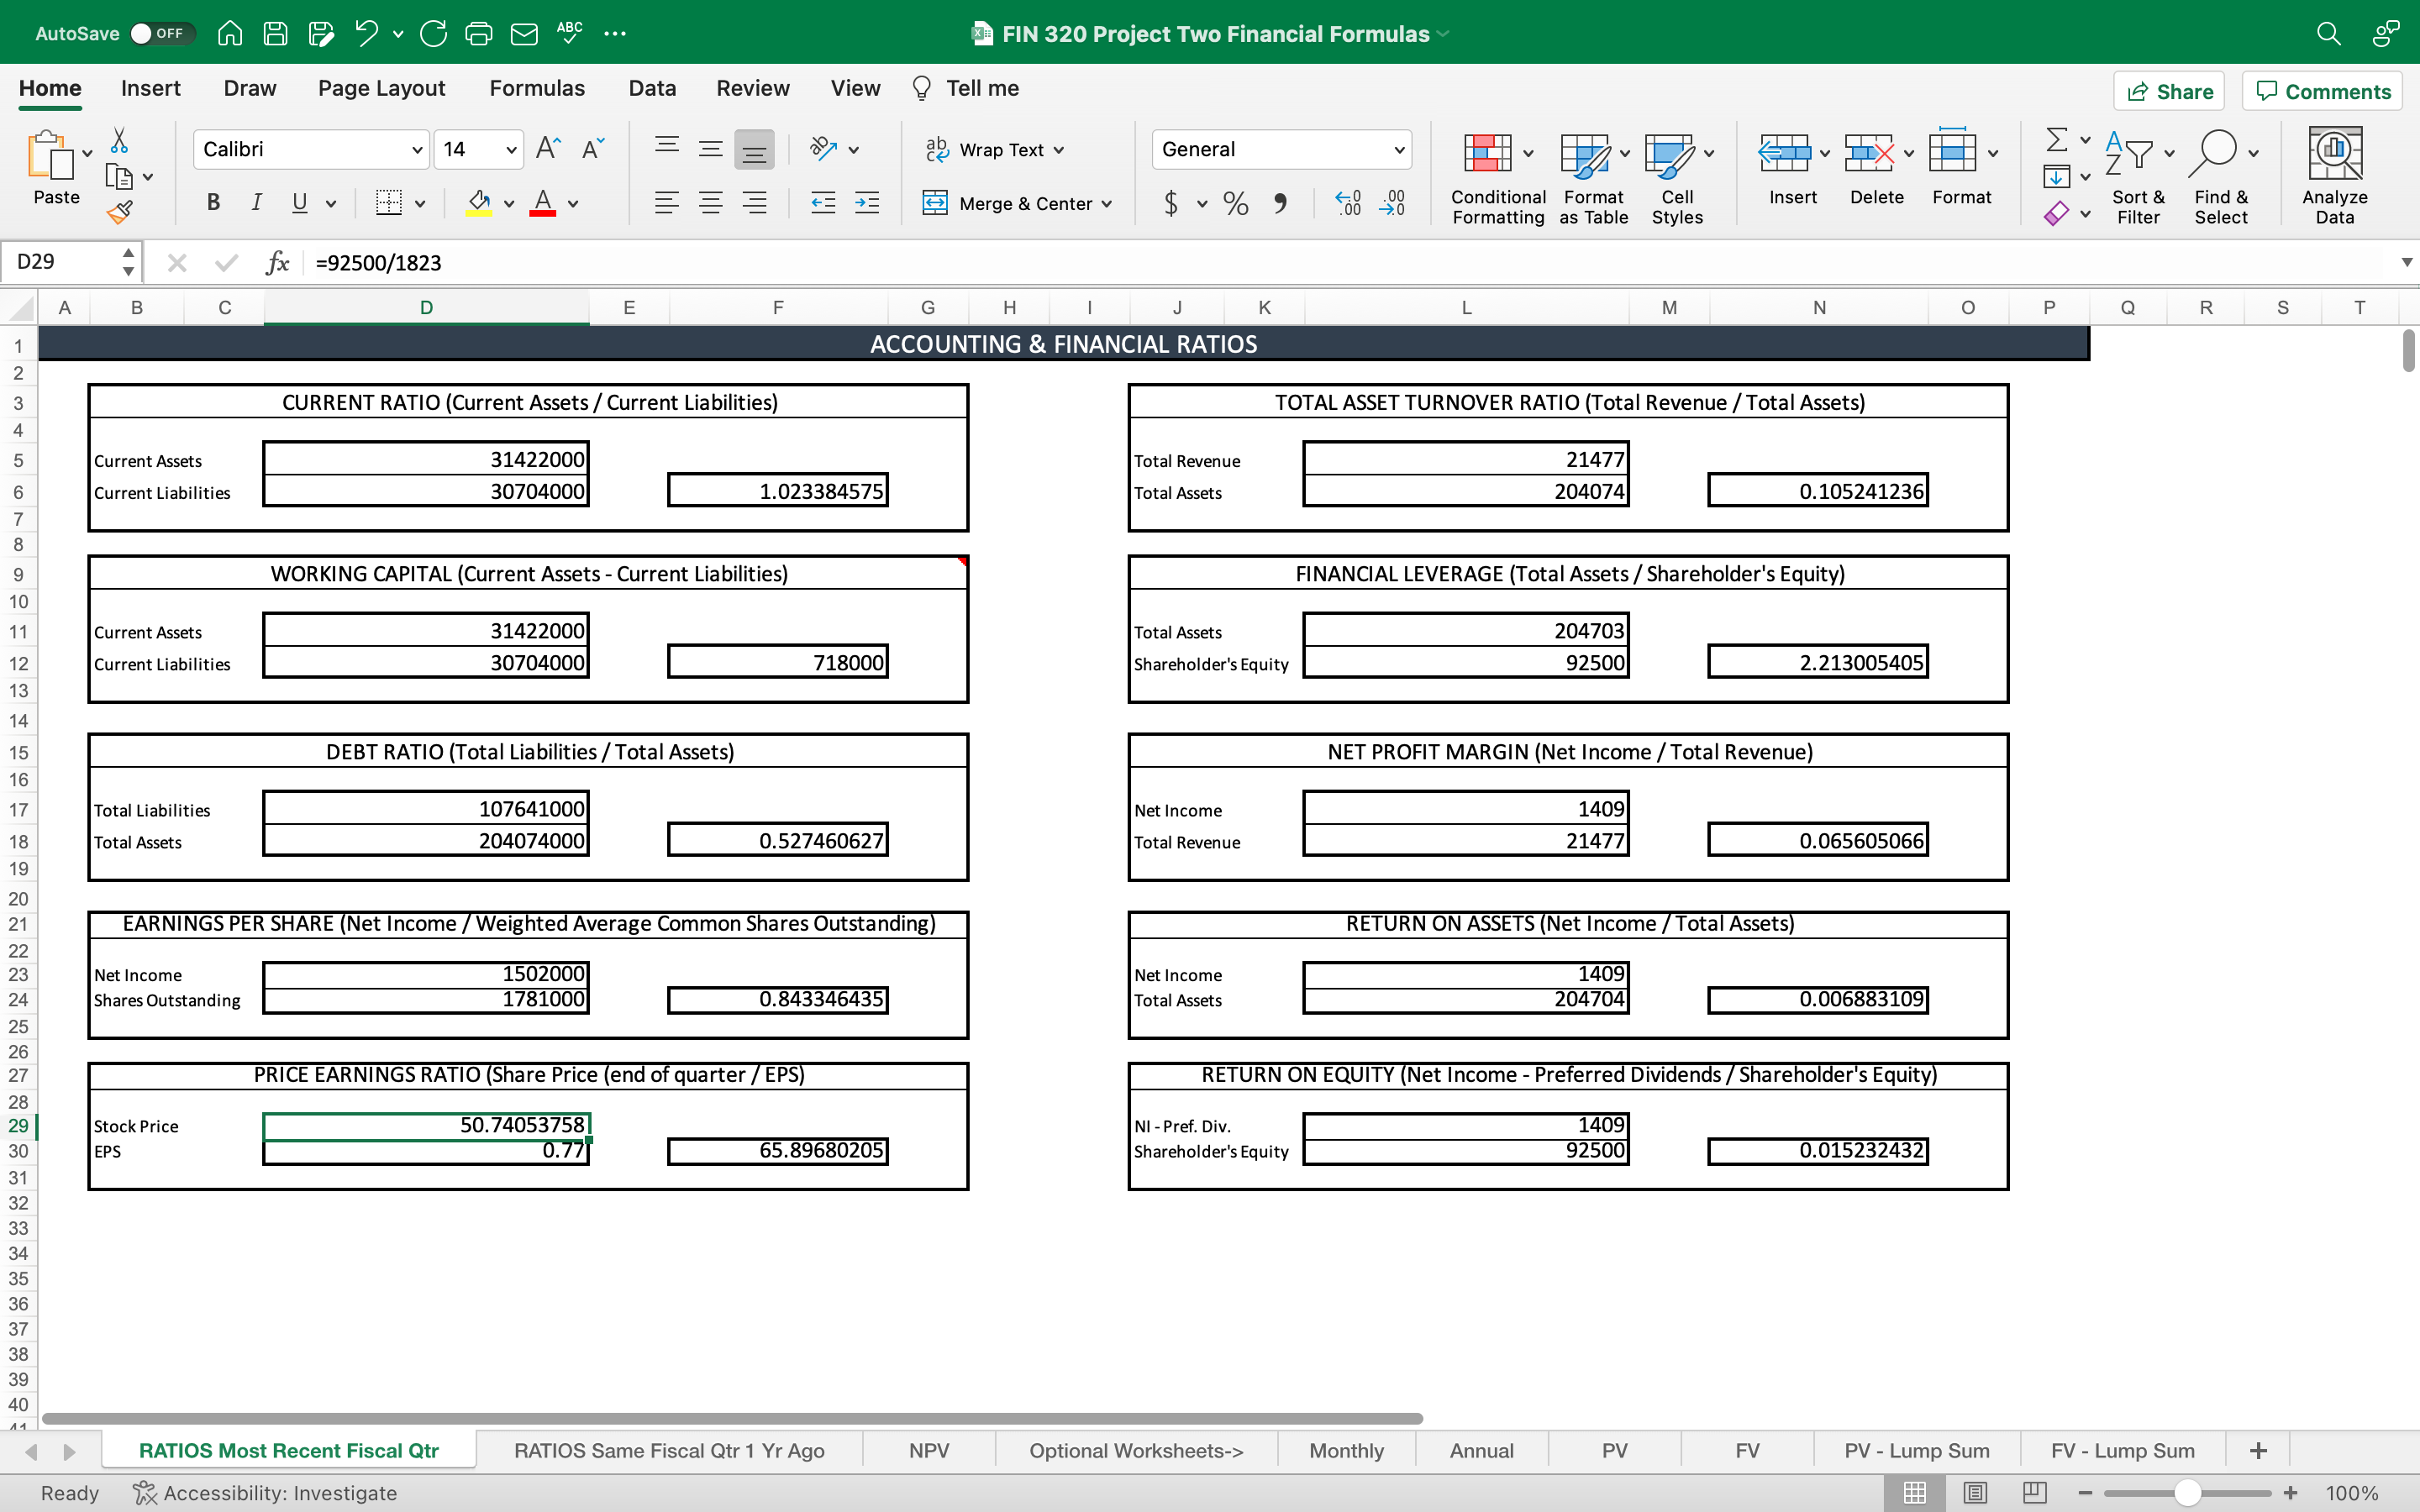
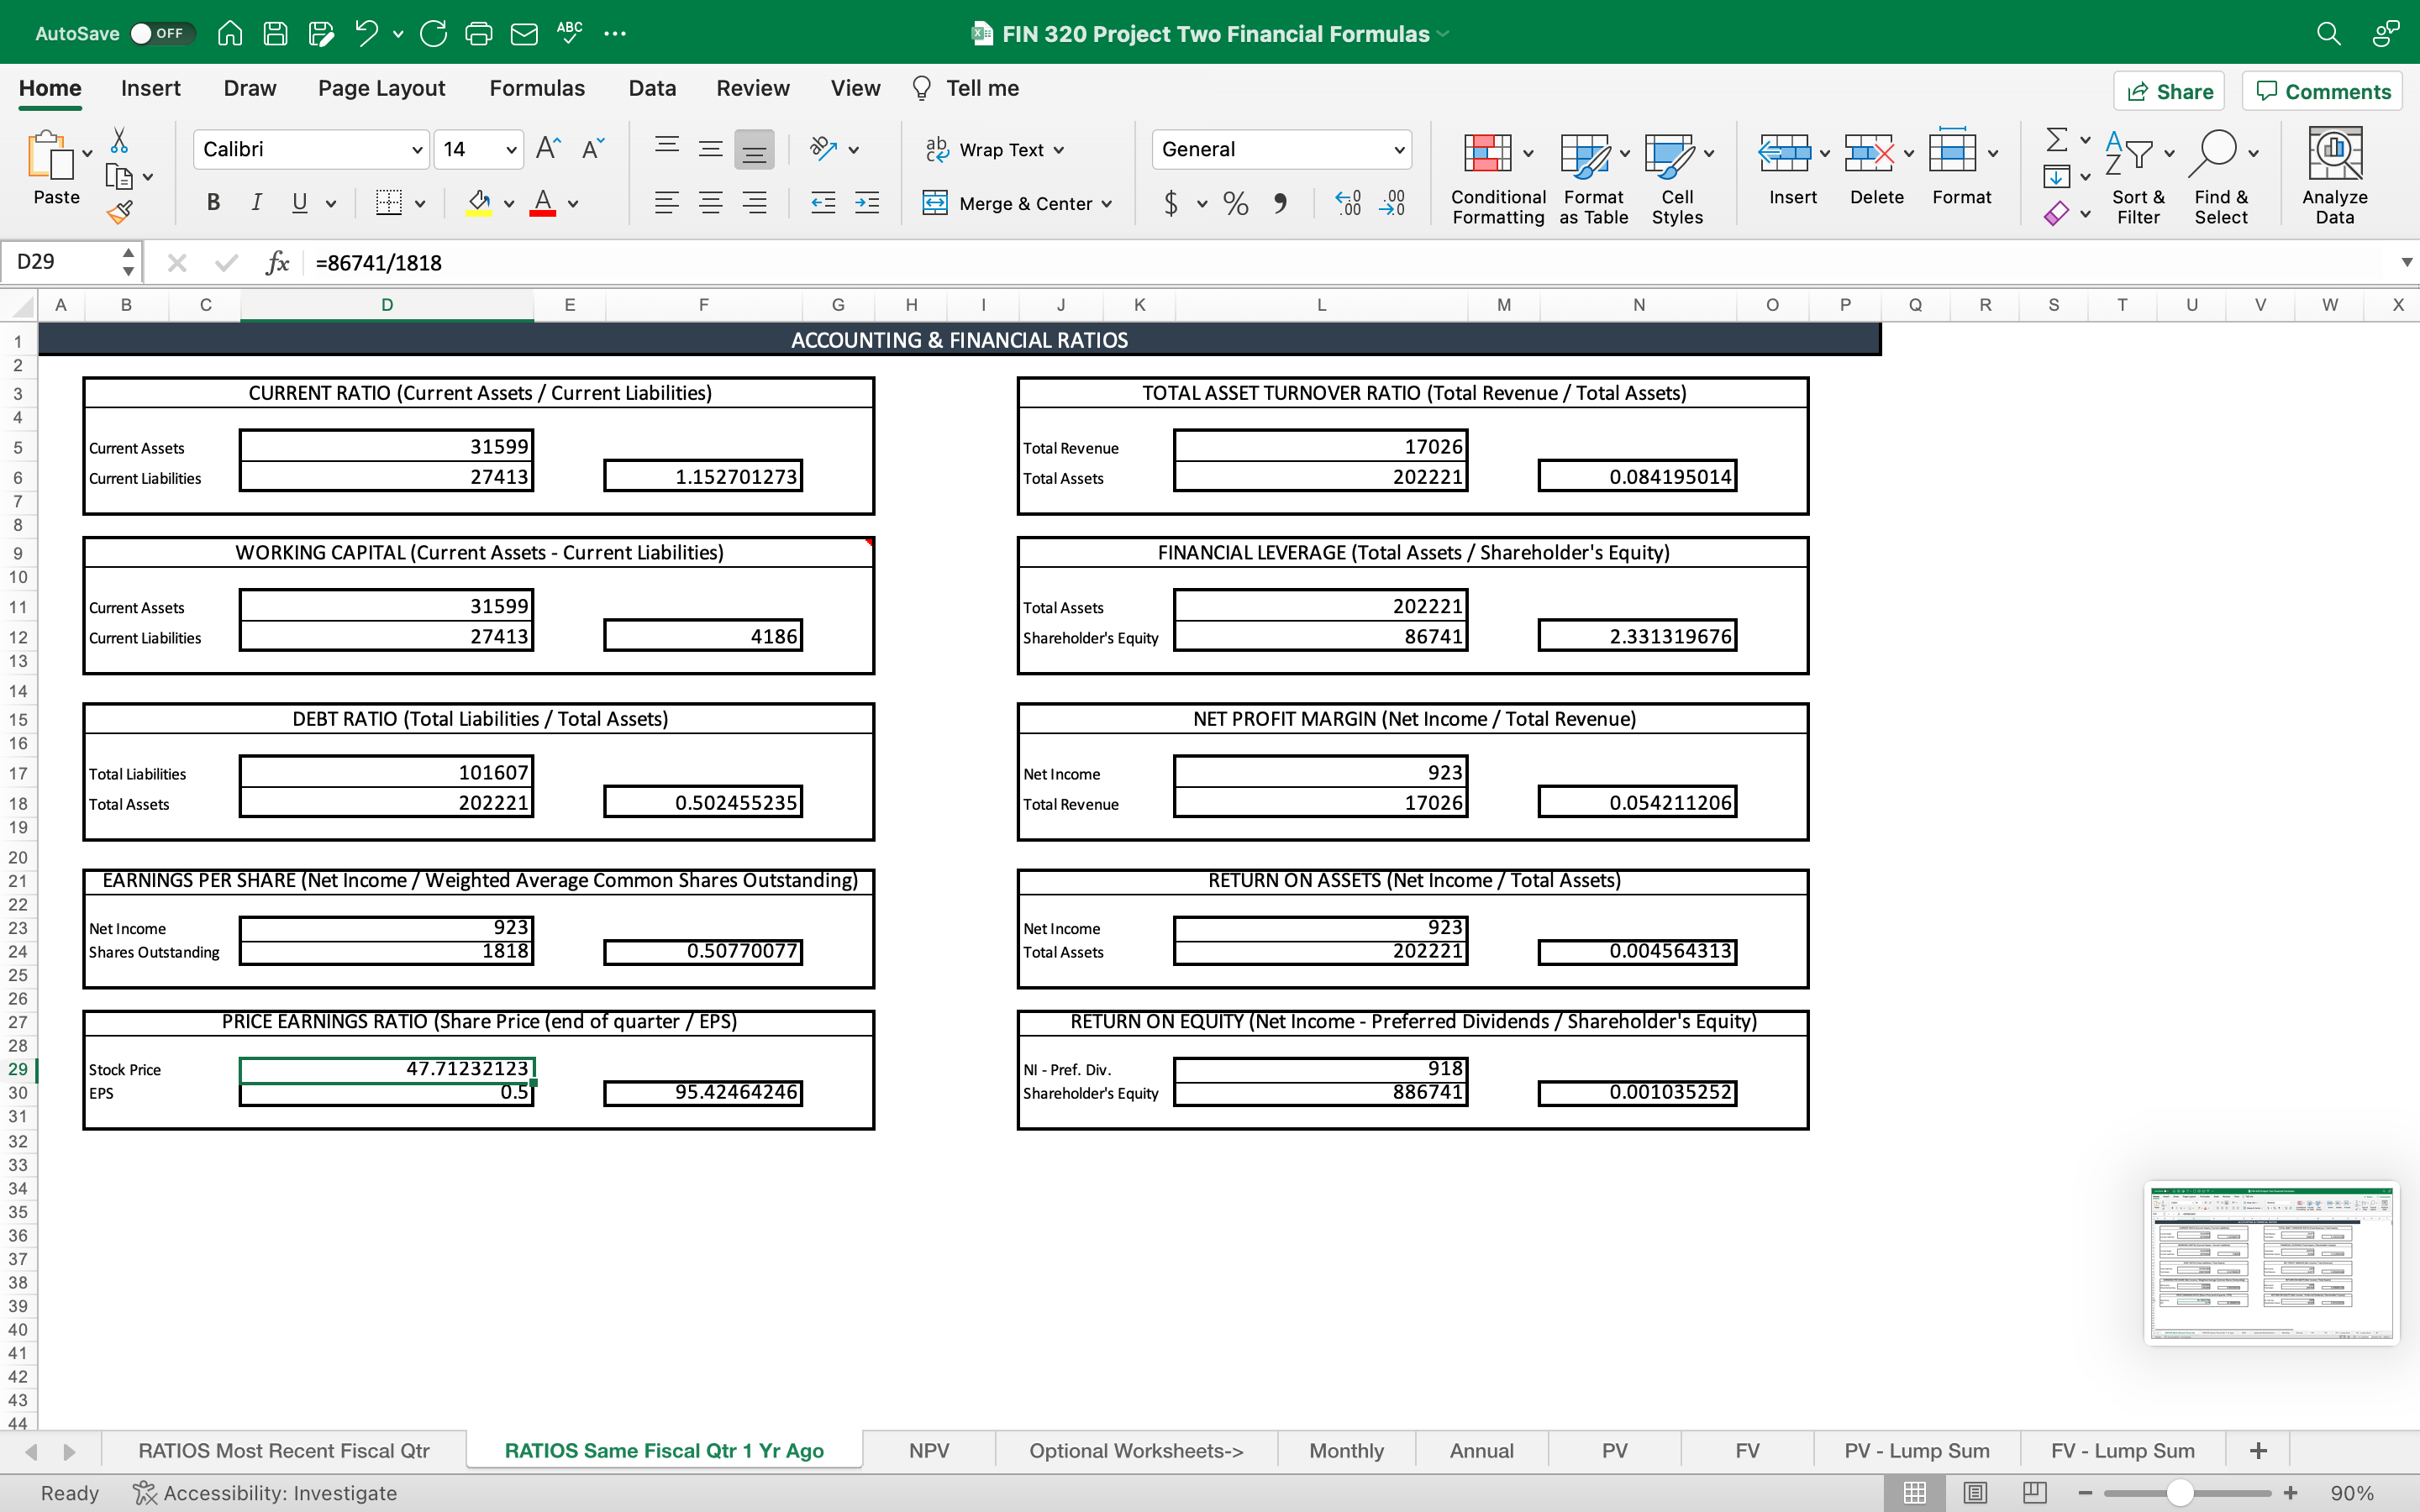
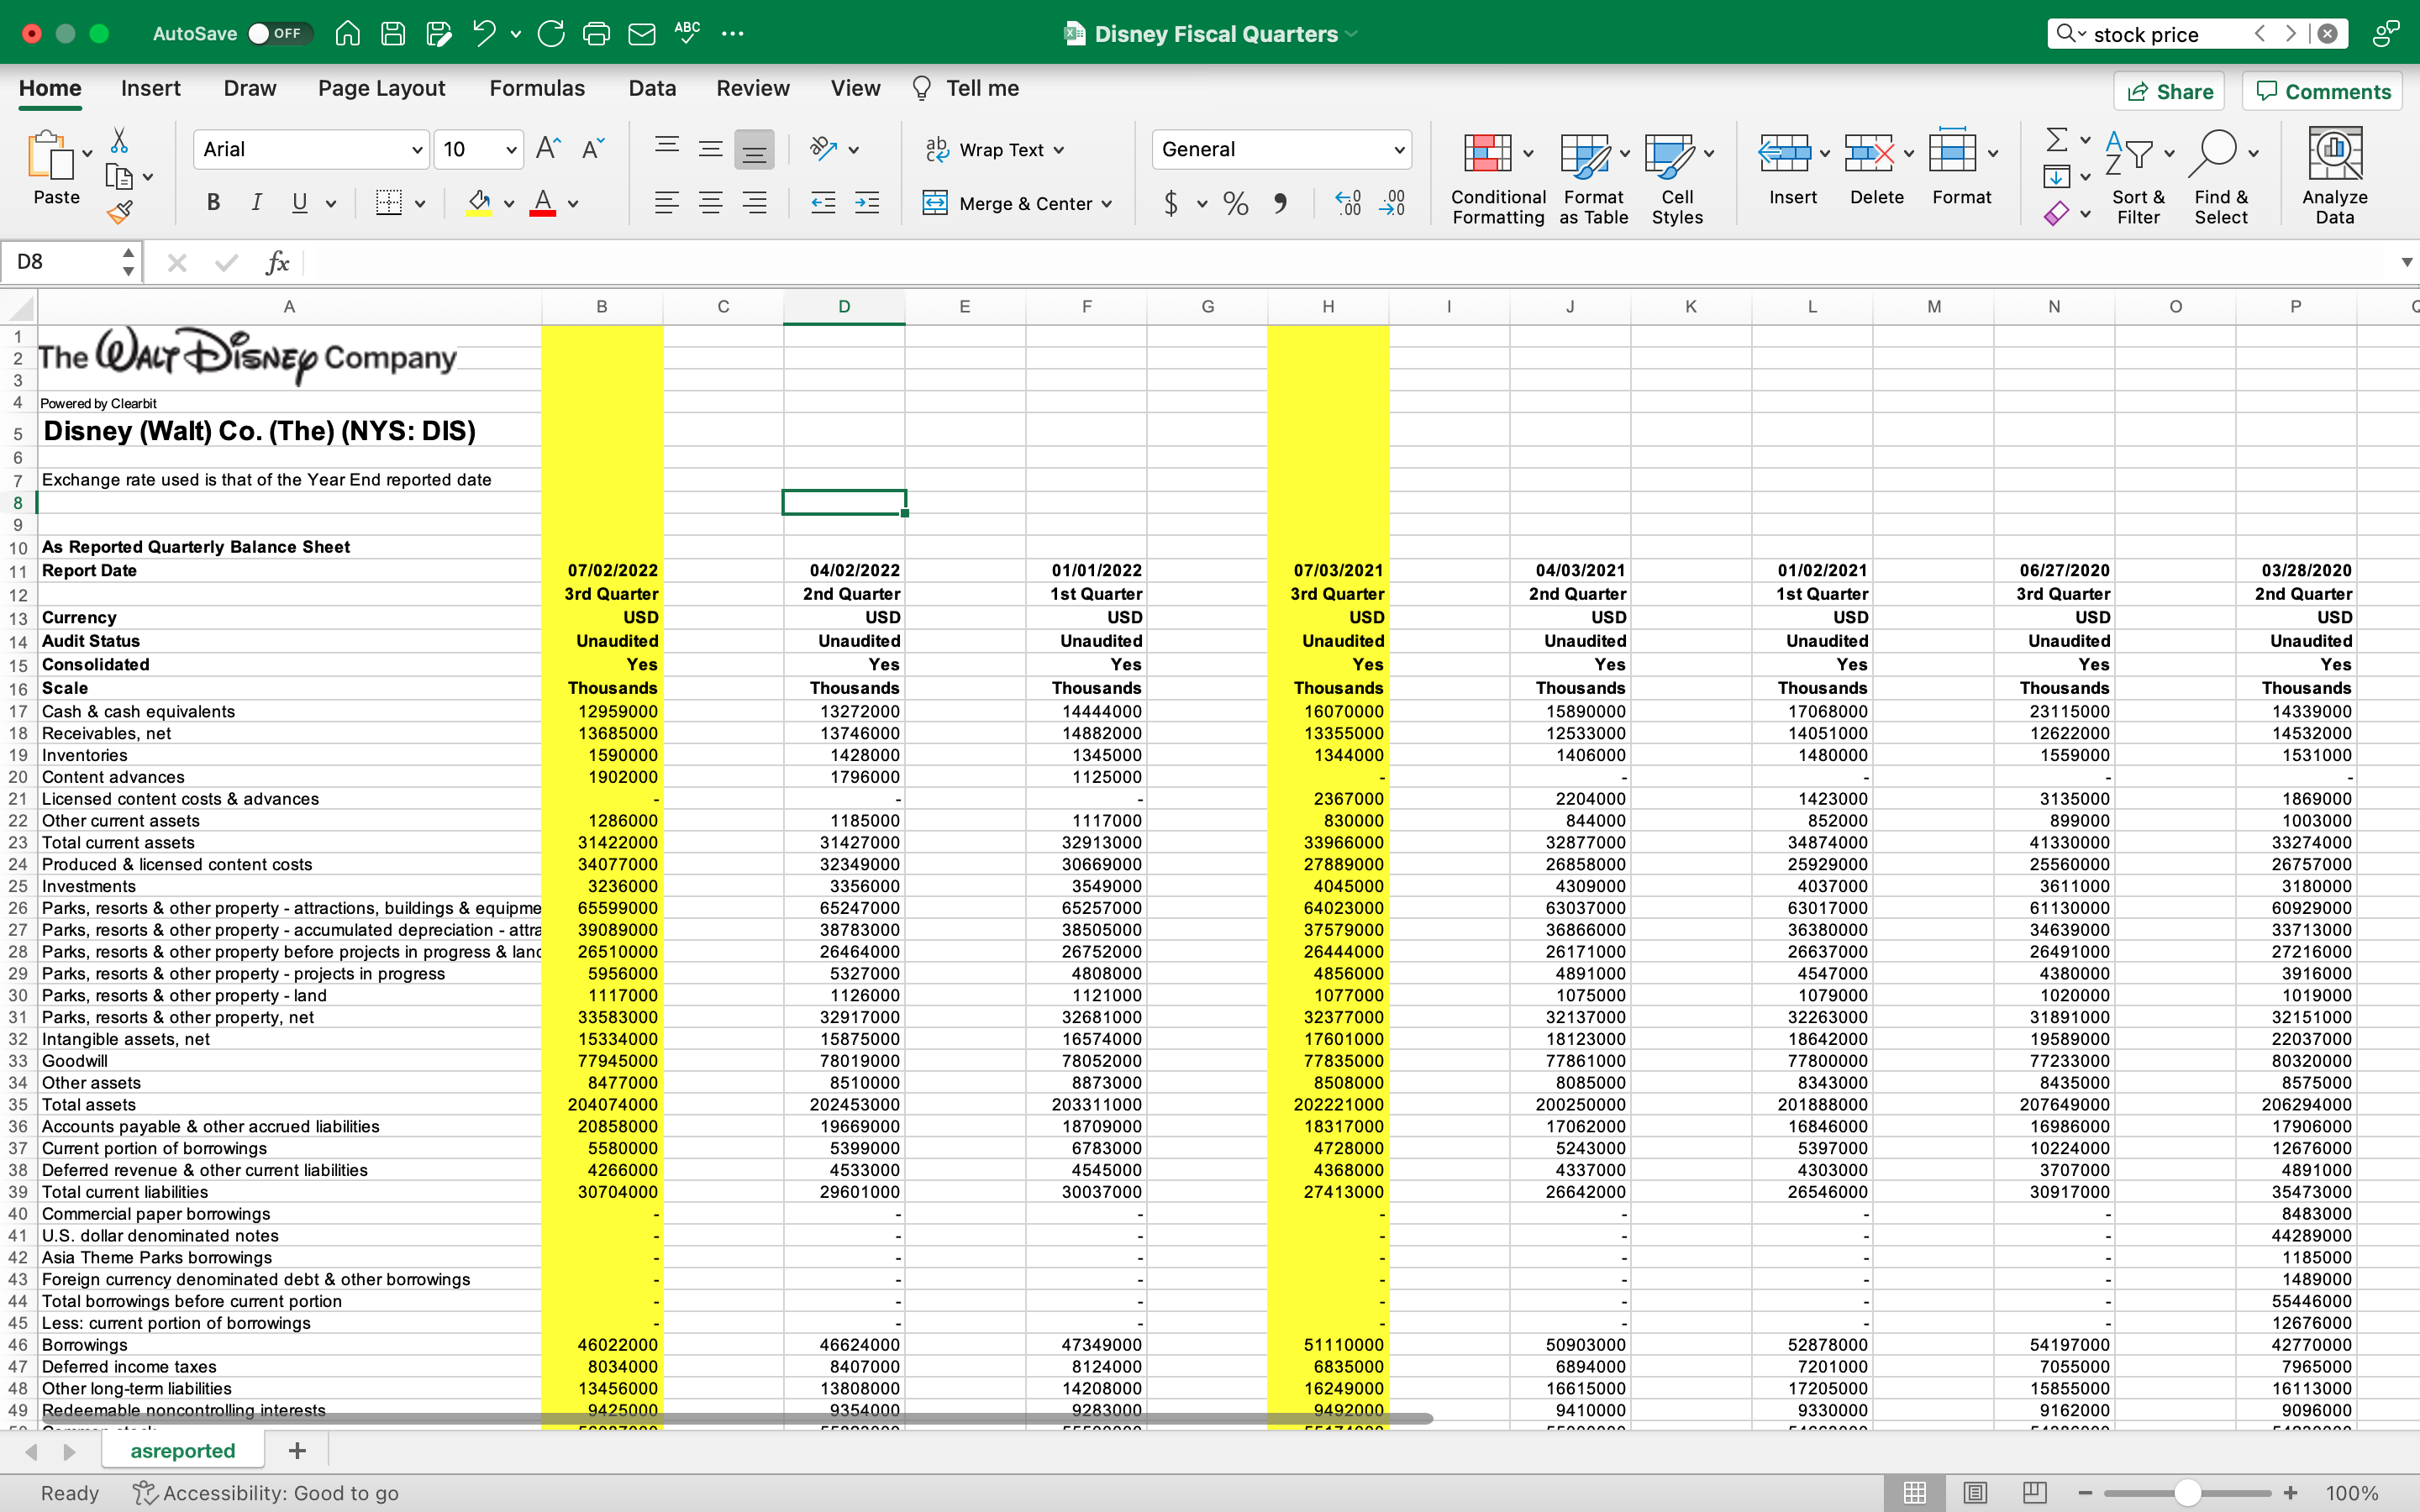
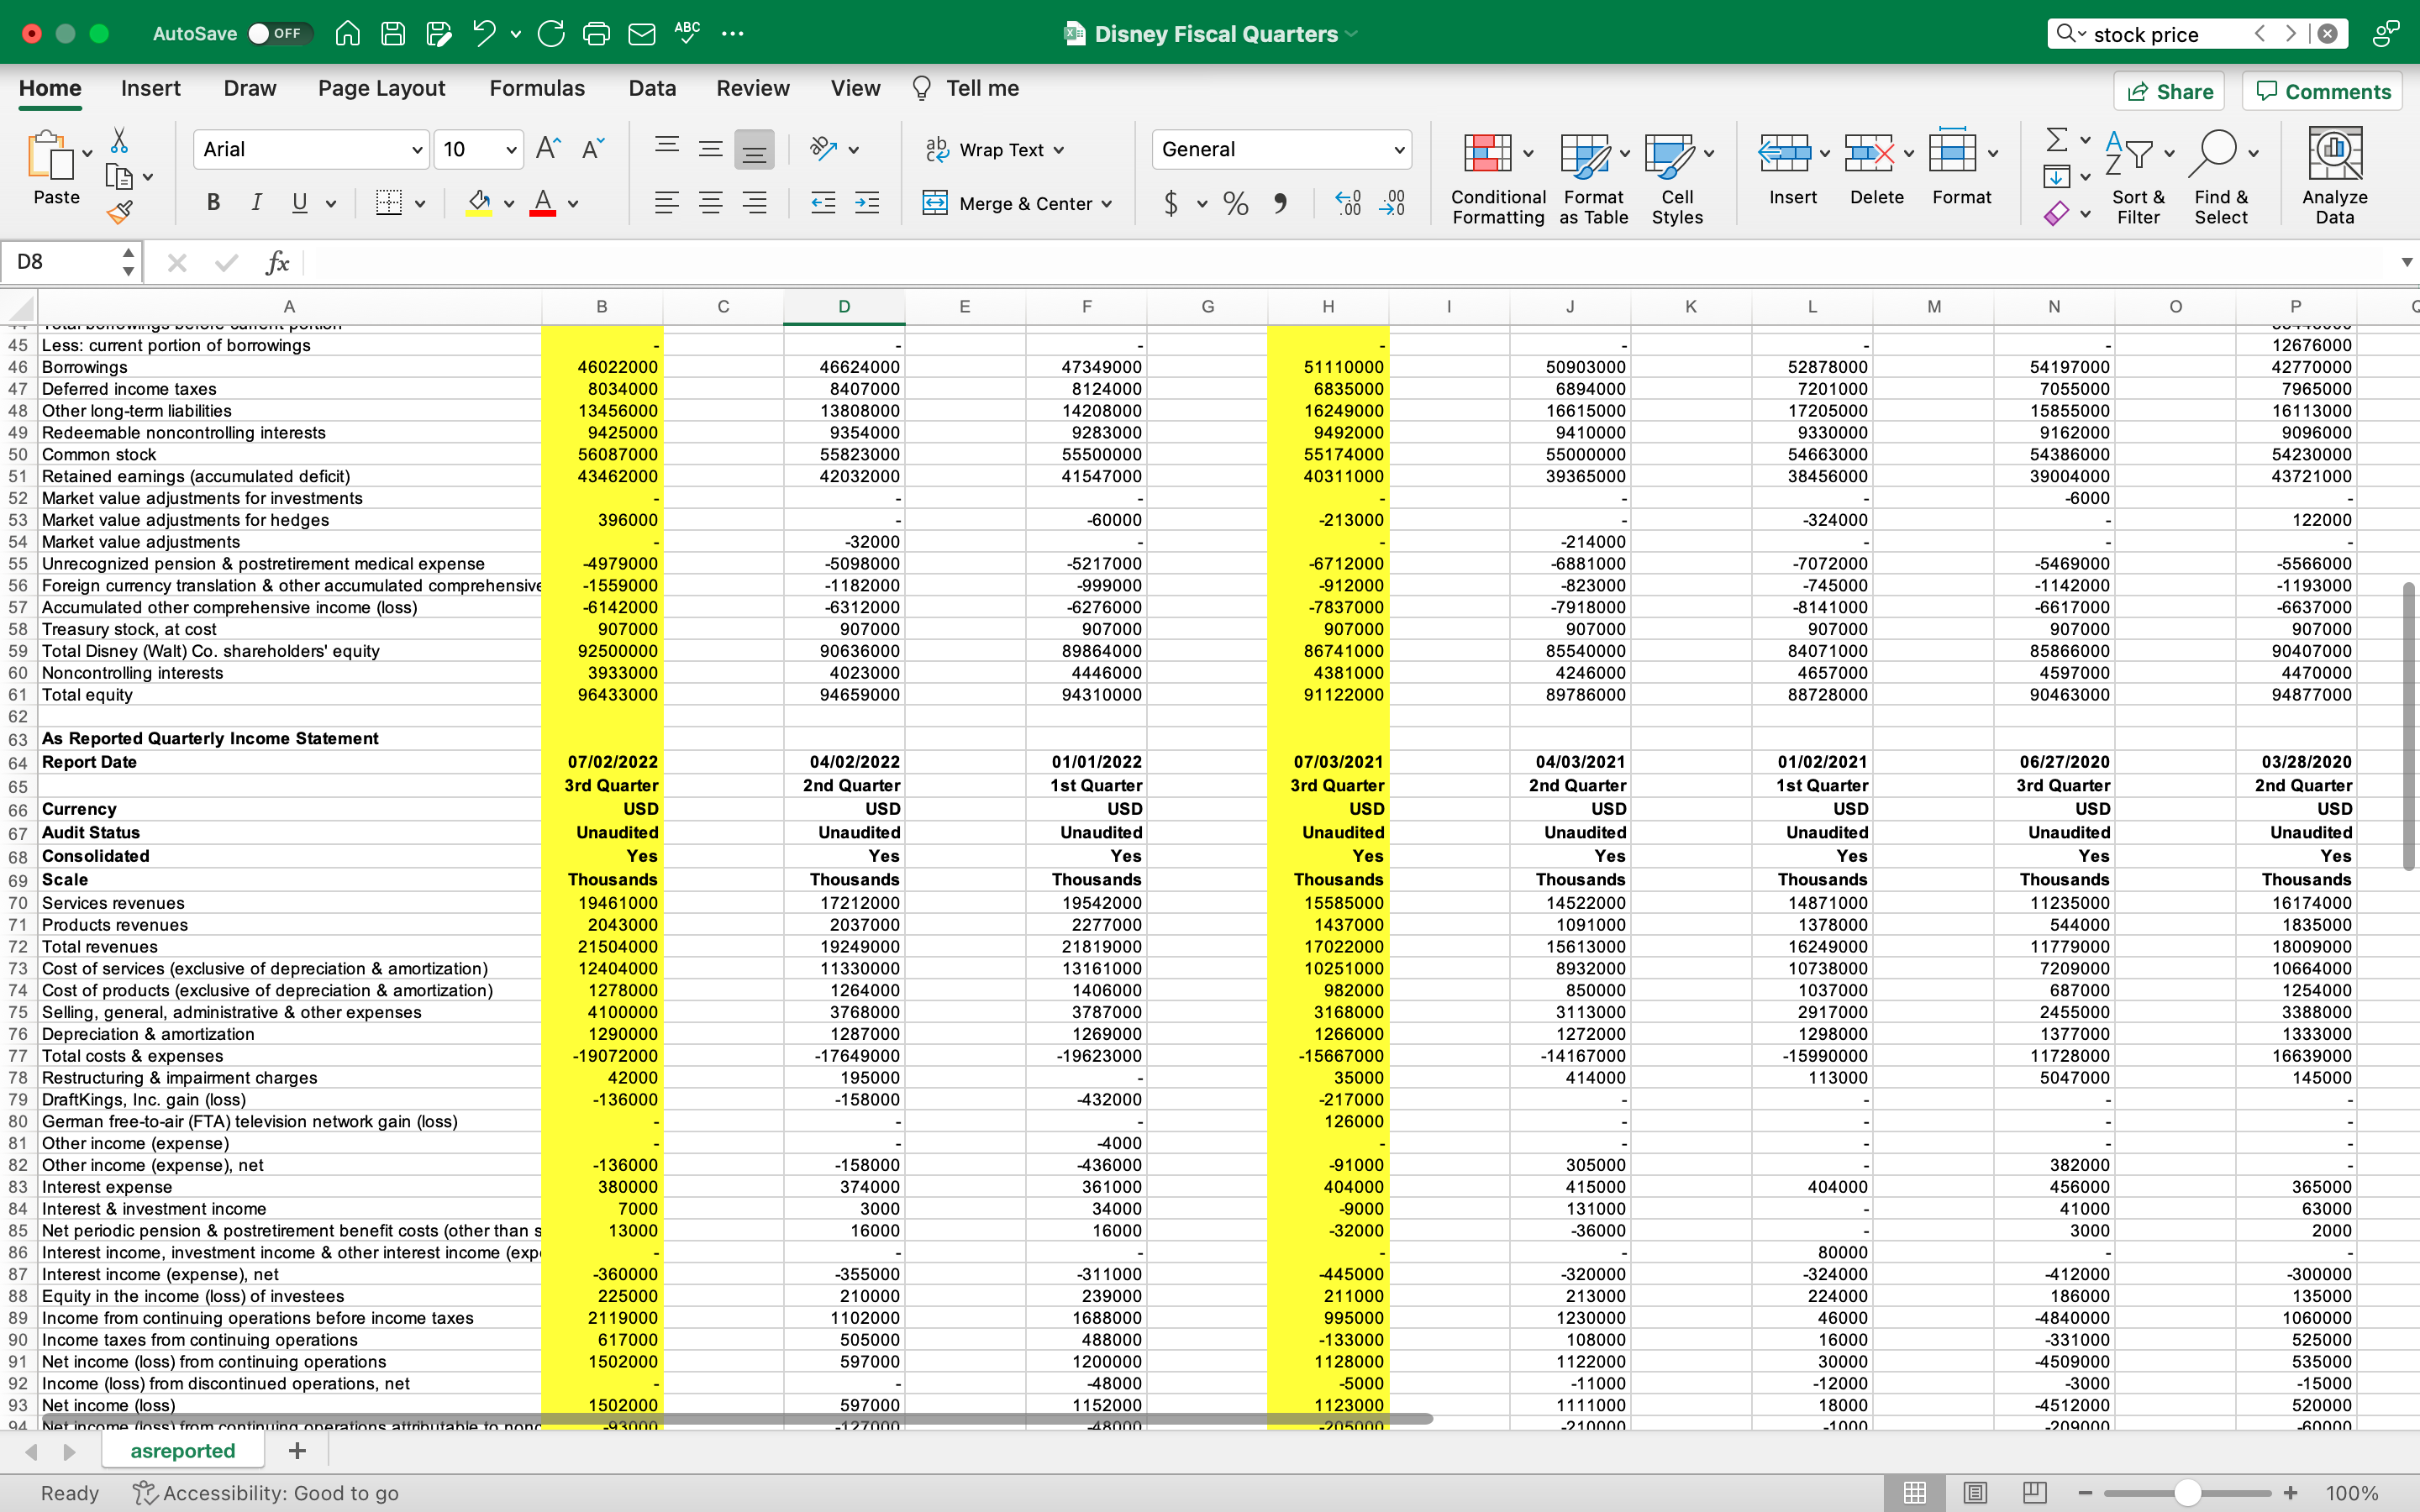
AutoSave OFF MAP ? CE ABC ... FIN 320 Project Two Financial Formulas Home Insert Draw Page Layout Formulas Data Review View Tell me Share Comments Calibri v 14 AA ab Wrap Text v General ZY AP - O. v Z Paste BIUV DV Av E = Merge & Center v $ ~ % 9 Conditional Format Cell Insert Delete Format Sort & Find & Analyze Formatting as Table Styles v Filter Select Data D29 X V fx =92500/1823 A B C D E F G H K M N O P Q R S T ACCOUNTING & FINANCIAL RATIOS CURRENT RATIO (Current Assets / Current Liabilities) TOTAL ASSET TURNOVER RATIO (Total Revenue / Total Assets) D CO V OR UI A W N - Current Assets 31422000 Total Revenue 21477 Current Liabilities 30704000 1.023384575 Total Assets 204074 0.105241236 WORKING CAPITAL (Current Assets - Current Liabilities FINANCIAL LEVERAGE (Total Assets / Shareholder's Equity) 10 11 Current Assets 31422000 Total Assets 204703 12 Current Liabilities 30704000 718000 Shareholder's Equity 92500 2.213005405 13 14 15 DEBT RATIO (Total Liabilities / Total Assets) NET PROFIT MARGIN (Net Income / Total Revenue) 16 17 Total Liabilities 107641000 Net Income 1409 18 Total Assets 204074000 0.527460627 Total Revenue 21477 0.065605066 19 20 21 EARNINGS PER SHARE (Net Income / Weighted Average Common Shares Outstanding) RETURN ON ASSETS (Net Income / Total Assets) 22 23 Net Income 1502000 Net Income 1409 24 Shares Outstanding 1781000 0.843346435 Total Assets 204704 0.006883109 25 26 27 PRICE EARNINGS RATIO (Share Price (end of quarter / EPS) RETURN ON EQUITY (Net Income - Preferred Dividends / Shareholder's Equity) 28 29 Stock Price 50.74053758 NI - Pref. Div. 1409 30 EPS 0.77 65.89680205 Shareholder's Equity 92500 0.015232432 31 32 33 34 35 36 37 38 39 40 RATIOS Most Recent Fiscal Qtr RATIOS Same Fiscal Qtr 1 Yr Ago NPV Optional Worksheets-> Monthly Annual PV FV PV - Lump Sum FV - Lump Sum + Ready Accessibility: Investigate + 100%AutoSave OFF MAP ? CE ABC ... FIN 320 Project Two Financial Formulas Home Insert Draw Page Layout Formulas Data Review View Tell me Share Comments Calibri 14 AA ab Wrap Text General LY AP - O. v Z Paste BIUV DV Av E EE Merge & Center v $ ~ % " Conditional Format Cell Insert Delete Format Sort & Find & Analyze Formatting as Table Styles Filter Select Data D29 X V fx =86741/1818 B C D E F G H K M N O P Q R S T U V W X ACCOUNTING & FINANCIAL RATIOS CURRENT RATIO (Current Assets / Current Liabilities) TOTAL ASSET TURNOVER RATIO (Total Revenue / Total Assets) Current Assets 31599 Total Revenue 17026 Current Liabilities 27413 1.152701273 Total Assets 202221 0.084195014 WORKING CAPITAL (Current Assets - Current Liabilities) FINANCIAL LEVERAGE (Total Assets / Shareholder's Equity) 10 Current Assets 31599 Total Assets 202221 12 Current Liabilities 27413 4186 Shareholder's Equity 86741 2.331319676 13 14 15 DEBT RATIO (Total Liabilities / Total Assets NET PROFIT MARGIN (Net Income / Total Revenue 16 Total Liabilities 101607 Net Income 923 18 Total Assets 202221 0.502455235 Total Revenue 17026 0.054211206 19 20 21 EARNINGS PER SHARE (Net Income / Weighted Average Common Shares Outstanding) RETURN ON ASSETS (Net Income / Total Assets 22 23 Net Income 923 Net Income 923 24 Shares Outstanding 1818 0.50770077 Total Assets 202221 0.004564313 25 26 27 PRICE EARNINGS RATIO (Share Price (end of quarter / EPS) RETURN ON EQUITY (Net Income - Preferred Dividends / Shareholder's Equity 28 29 Stock Price 47.71232123 NI - Pref. Div. 918 30 EPS 0.5T 95.42464246 shareholder's Equity 886741 0.001035252 31 32 33 34 35 36 37 38 39 40 41 42 43 44 D RATIOS Most Recent Fiscal Qtr RATIOS Same Fiscal Qtr 1 Yr Ago NPV Optional Worksheets-> Monthly Annual PV FV PV - Lump Sum FV - Lump Sum + Ready ux Accessibility: Investigate + 90%AutoSave OFF MAP ? CEO ABC ... Disney Fiscal Quarters Q stock price Home Insert Draw Page Layout Formulas Data Review View Tell me Share Comments Arial v 10 VA A ap Wrap Text v General Paste BIUVV DV Av E = Merge & Center v $ ~ % " Conditional Format Cell Insert Delete Format Sort & Find & Analyze Formatting as Table Styles v Filter Select Data D8 + X V fx A B C D E F G H K L M N AWN - The WALT DISNEY Company Powered by Clearbit 5 Disney (Walt) Co. (The) (NYS: DIS) Exchange rate used is that of the Year End reported date 6 00 10 As Reported Quarterly Balance Sheet 11 Report Date 07/02/2022 04/02/2022 01/01/2022 07/03/2021 04/03/2021 01/02/2021 06/27/2020 03/28/2020 12 Brd Quarter 2nd Quarter Ist Quarter 3rd Quarter 2nd Quarter 1st Quarter 3rd Quarter 2nd Quarter 13 Currency US USD USD USE USD USD USD USD 14 Audit Status Unaudited Unaudited Unaudited Unaudited Unaudited Unaudited Unaudited Unaudited 15 Consolidated Yes Yes Yes Yes Yes Yes Yes Yes 16 Scale Thousands Thousands Thousands Thousands Thousands Thousands Thousands Thousands 17 Cash & cash equivalents 12959000 13272000 14444000 16070000 15890000 706800 23115000 14339000 18 Receivables, net 13685000 13746000 14882000 3355000 12533000 14051000 12622000 4532000 19 Inventories 1590000 428000 1345000 1344000 1406000 1480000 1559000 1531000 20 Content advances 1902000 796000 125000 21 Licensed content costs & advances 2367000 2204000 423000 135000 1869000 22 Other current assets 1286000 1 185000 1117000 830000 844000 85200 899000 1003000 23 Total current assets 1422000 31427000 32913000 3966000 32877000 34874000 41330000 33274000 24 Produced & licensed content costs 34077000 32349000 30669000 27889000 26858000 25929000 25560000 26757000 25 Investments 3236000 3356000 3549000 4045000 4309000 4037000 3611000 3180000 26 Parks, resorts & other property - attractions, buildings & equipme 6559900 65247000 65257000 $4023000 63037000 6301700 61130000 60929000 27 Parks, resorts & other property - accumulated depreciation - attra 3908900 38783000 38505000 37579000 36866000 36380000 34639000 33713000 Parks, resorts & other property before projects in progress & land 26510000 2646400 6752000 26444000 26171000 2663700 26491000 27216000 29 Parks, resorts & other property - projects in progress 5956000 5327000 4808000 4856000 4891000 4547000 4380000 3916000 30 Parks, resorts & other property - land 1117000 1 126000 121000 1077000 1075000 1079000 1020000 1019000 31 Parks, resorts & other property, net 33583000 32917000 32681000 2377000 32137000 2263000 31891000 32151000 32 Intangible assets, net 15334000 15875000 16574000 17601000 18123000 18642000 19589000 22037000 33 Goodwill 77945000 78019000 78052000 7835000 77861000 7800000 77233000 80320000 34 Other assets 8477000 8510000 8873000 8508000 8085000 834300 8435000 8575000 35 Total assets 204074000 202453000 0331 1000 202221000 200250000 20188800 207649000 06294000 36 Accounts payable & other accrued liabilities 0858000 19669000 18709000 18317000 17062000 16846000 16986000 7906000 37 Current portion of borrowings 5580000 5399000 6783000 4728000 5243000 5397000 022400 2676000 38 Deferred revenue & other current liabilities 4266000 4533000 4545000 4368000 4337000 430300 3707000 4891000 39 Total current liabilities 0704000 29601000 30037000 2741300 26642000 654600 30917000 35473000 40 Commercial paper borrowings 8483000 41 U.S. dollar denominated notes 44289000 42 Asia Theme Parks borrowings 185000 43 Foreign currency denominated debt & other borrowings 1489000 44 Total borrowings before current portion 65446000 Less: current portion of borrowings 12676000 46 Borrowings 46022000 46624000 47349000 51110000 50903000 52878000 54197000 2770000 47 Deferred income taxes 8034000 8407000 $124000 6835000 6894000 7201000 7055000 7965000 48 Other long-term liabilities 3456000 3808000 4208000 624900 6615000 720500 15855000 6113000 Redeemable noncontrolling interests 9425000 9354000 9283000 9492000 9410000 9330000 9162000 9096000 asreported Ready 1 Accessibility: Good to go 100%AutoSave OFF MAP ? CG ABC ... Disney Fiscal Quarters Q stock price Home Insert Draw Page Layout Formulas Data Review View Tell me Share Comments Arial v 10 VA A ap Wrap Text v General ZY AY - O. Paste BIU V DVAv E Merge & Center v $ ~ % " Conditional Format Cell Insert Delete Format Sort & Find & Analyze Formatting as Table Styles Filter Select Data D8 fx A B C D E F G H K M N O UUTTUUUU 5 Less: current portion of borrowings 12676000 46 Borrowings 46022000 46624000 47349000 51110000 50903000 52878000 54197000 2770000 47 Deferred income taxes 8034000 8407000 8124000 6835000 6894000 7201000 7055000 7965000 48 Other long-term liabilities 13456000 13808000 14208000 6249000 6615000 1720500 15855000 6113000 49 Redeemable noncontrolling interests 9425000 9354000 9283000 9492000 9410000 9330000 9162000 9096000 Common stock 56087000 5582300 65500000 55174000 55000000 54663000 5438600 54230000 51 Retained earnings (accumulated deficit) 3462000 42032000 41547000 10311000 39365000 $8456000 39004000 43721000 52 Market value adjustments for investments 6000 53 Market value adjustments for hedges 396000 -60000 -213000 -324000 12200 Market value adjustments -32000 214000 55 Unrecognized pension & postretirement medical expense -4979000 5098000 5217000 6712000 -6881000 7072000 5469000 5566000 56 Foreign currency translation & other accumulated comprehensive -1559000 1182000 999000 912000 -823000 74500 1142000 1 193000 57 Accumulated other comprehensive income (loss) 6142000 6312000 276000 7837000 7918000 8141000 6617000 6637000 58 Treasury stock, at cost 90700 907000 907000 907000 907000 907000 90700 907000 59 Total Disney (Walt) Co. shareholders' equity 92500000 90636000 89864000 36741000 $5540000 84071000 5866000 90407000 60 Noncontrolling interests 393300 4023000 4446000 4381000 4246000 4657000 4597000 4470000 61 Total equity 6433000 94659000 94310000 91122000 8978600 88728000 90463000 94877000 62 63 As Reported Quarterly Income Statement 64 Report Date 07/02/2022 04/02/2022 01/01/2022 07/03/2021 04/03/2021 01/02/2021 06/27/2020 03/28/2020 65 3rd Quarter 2nd Quarter Ist Quarter 3rd Quarter 2nd Quarter 1st Quarter 3rd Quarter 2nd Quarter 66 Currency US USD USD USD USD USD USD USD 67 Audit Status Unaudited Unaudited Unaudited Unaudited Unaudited Unaudited Unaudited Unaudited 68 Consolidated Yes Yes Yes Yes Yes Yes Yes Yes 69 Scale Thousands Thousands Thousands Thousands Thousands Thousands Thousands Thousands 70 Services revenues 19461000 17212000 9542000 15585000 14522000 14871000 1235000 6174000 71 Products revenues 2043000 2037000 2277000 1437000 1091000 137800 544000 1835000 72 Total revenues 21504000 19249000 21819000 17022000 5613000 1624900 1 1779000 18009000 73 Cost of services (exclusive of depreciation & amortization) 12404000 1330000 3161000 10251000 8932000 10738000 209000 0664000 74 Cost of products (exclusive of depreciation & amortization) 1278000 1264000 1406000 982000 850000 1037000 687000 1254000 75 Selling, general, administrative & other expenses 4100000 $768000 787000 3168000 $113000 917000 2455000 3388000 76 Depreciation & amortization 1290000 1287000 1269000 1266000 1272000 129800 1377000 1333000 77 Total costs & expenses 19072000 -17649000 19623000 15667000 14167000 15990000 1728000 16639000 78 Restructuring & impairment charges 42000 195000 35000 414000 1 13000 5047000 145000 79 DraftKings, Inc. gain (loss) 136000 158000 -432000 217000 80 German free-to-air (FTA) television network gain (loss) 126000 81 Other income (expense 4000 82 Other income (expense), net -136000 -158000 436000 91000 305000 382000 Interest expense 380000 374000 361000 404000 15000 404000 456000 365000 84 Interest & investment income 7000 3000 34000 -9000 31000 41000 63000 85 Net periodic pension & postretirement benefit costs (other than s 13000 16000 16000 -32000 36000 3000 2000 86 Interest income, investment income & other interest income (exp 80000 87 Interest income (expense), net -360000 355000 311000 445000 -320000 -324000 412000 -300000 88 Equity in the income (loss) of investees 225000 210000 239000 21 1000 213000 24000 186000 135000 89 Income from continuing operations before income taxes 21 19000 102000 688000 995000 1230000 46000 1840000 1060000 90 Income taxes from continuing operations 617000 05000 488000 133000 108000 16000 -33100 525000 91 Net income (loss) from continuing operations 1502000 597000 200000 112800 122000 30000 450900 535000 Income (loss) from discontinued operations, net -48000 -500 -11000 12000 -3000 -15000 93 Net income (loss) 1502000 597000 152000 123000 1111000 18000 4512000 520000 Q4 Net income fi accl from continuing onerations attributable to none -93000 -127000 -48000 -205000 -210000 -1000 -2nannn asreported Ready Accessibility: Good to go 100%AutoSave OFF MAP ? CG ABC ... Disney Fiscal Quarters Q stock price Home Insert Draw Page Layout Formulas Data Review View Tell me Share Comments Arial v 10 VA A ap Wrap Text v General TIX V V ZY AP - O. Paste BIUV vAv E = Merge & Center v $ ~ % " Conditional Format Cell Insert Delete Format Sort & Find & Analyze Formatting as Table Styles v Filter Select Data D8 4 fx B C D E G H K M N 91 Net income (loss) from continuing operations 1502000 597000 200000 128000 1 122000 30000 4509000 535000 92 Income (loss) from discontinued operations, net -48000 -5000 -1 1000 12000 -3000 -15000 Net income (loss) 1502000 597000 152000 123000 111000 18000 4512000 520000 94 Net income (loss) from continuing operations attributable to nonc -93000 127000 -48000 205000 210000 -100 -209000 6000 95 Net income (loss) attributable to The Walt Disney Company (Disn 1409000 470000 104000 918000 901000 1700 4721000 460000 96 Weighted average shares outstanding - basic 1823000 1822000 1819000 1818000 1817000 1812000 1809000 1808000 97 Weighted average shares outstanding - diluted 1825000 182800 1828000 1830000 1829000 1823000 1809000 816000 98 Year end shares outstanding 1781000 781000 1781000 1781000 1781000 781000 781000 1781000 99 Earnings (loss) per share - continuing operations - basic 0.77 0.26 0.63 0.51 05 0.02 -2.61 0.26 100 Earnings (loss) per share - discontinued operations - basic 0.03 0.01 -0.01 0.01 101 Net earnings (loss) per share - basic 0.77 0.26 0.6 0.5 0.5 0.01 -2.61 0.25 102 Eamings (loss) per share - continuing operations - diluted 0.77 0.26 0.63 0.5 0.5 0.02 -2.61 0.26 103 Eamings (loss) per share - discontinued operations - diluted -0.03 -0.01 -0.01 -0.01 104 Net earnings (loss) per share - diluted 0.77 0.26 0.61 0.5 0.49 0.01 -2.61 0.25 105 Dividends declared per common share 0.88 0.88 106 107 As Reported Quarterly Retained Earnings 108 Report Date 07/02/2022 04/02/2022 01/01/2022 07/03/2021 04/03/2021 01/02/2021 06/27/2020 03/28/2020 109 3rd Quarter 2nd Quarter Ist Quarter 3rd Quarter 2nd Quarter 1st Quarter 3rd Quarter 2nd Quarter 110 Currency USE USD USD US USD US USD US 111 Audit Status Unaudited Unaudited Unaudited Unaudited Unaudited Unaudited Unaudited Unaudited 1 12 Consolidated Yes Yes Yes Yes Yes Yes Yes Yes 113 Scale Thousands Thousands Thousands Thousands Thousands Thousands Thousands Thousands 114 Previous retained earnings 42032000 41547000 40429000 39365000 38456000 38315000 43721000 43202000 115 Dividends 9000 116 Adoption of new lease accounting guidance 3000 500 10000 1 17 Distributions & other retained earnings 21000 15000 14000 2500 13000 1400 4000 68000 118 Retained earnings 43462000 42032000 41547000 40311000 39365000 $8456000 39004000 4372100 119 120 As Reported Quarterly Cash Flow 121 Report Date 07/02/2022 04/02/2022 01/01/2022 07/03/2021 04/03/2021 01/02/2021 06/27/2020 03/28/2020 122 3rd Quarter 2nd Quarter 1st Quarter 3rd Quarter 2nd Quarter 1st Quarter 3rd Quarter 2nd Quarter 123 Currency USD USD US USD USD USI USD USD 124 Audit Status Unaudited Unaudited Unaudited Unaudited Unaudited Unaudited Unaudited Unaudited 125 Consolidated Yes Yes Yes Yes Yes Yes Yes Yes 126 Sca Thousands Thousands Thousands Thousands Thousands Thousands Thousands Thousands 127 Net income (loss) from continuing operations 3299000 1797000 200000 228000 1152000 30000 1813000 708000 28 Depreciation & amortization 3846000 2556000 1269000 3836000 2570000 298000 4010000 2631000 129 Net loss (gain) on investments 79000 $32000 436000 325000 481000 3000 130 Goodwill & intangible asset impairment 953000 31 Net loss (gain) on acquisitions & investments 370000 132 Deferred income taxes $05000 983000 726000 749000 556000 105000 548000 133 Equity in the loss (income) of investees $74000 449000 -239000 648000 437000 224000 545000 134 Cash distributions received from equity investees 575000 406000 223000 546000 372000 19300 567000 135 Net change in produced & licensed content costs & advances 4306000 2279000 507000 3192000 1685000 77100 1483000 136 Net change in operating lease right of use assets / liabilities 127000 146000 36000 16000 137 Equity-based compensation 723000 450000 196000 28000 270000 134000 388000 246000 138 Pension & postretirement medical benefit cost amoritzation 465000 $10000 155000 139 Other adjustments, net 492000 264000 -7000 728000 190000 90000 471000 156000 140 Receivables 506000 342000 -1401000 301000 37000 -1324000 2100000 828000 asreported + Ready 12 Accessibility: Good to go 100%AutoSave OFF MAP ? CG ABC ... Disney Fiscal Quarters Q stock price Home Insert Draw Page Layout Formulas Data Review View Tell me Share Comments Arial v 10 VAA ap Wrap Text General TIX V V ZY AY - O. Paste BIUVV E Merge & Center v $ ~ % " Conditional Format Cell Insert Delete Format Sort & Find & Analyze Formatting as Table Styles Filter Select Data D8 fx B C D E F G H K M N O 131 Net loss (gain) on acquisitions & investments 370000 132 Deferred income taxes 605000 983000 726000 -749000 556000 -105000 548000 297000 133 Equity in the loss (income) of investees 674000 -449000 239000 648000 437000 224000 -545000 359000 134 Cash distributions received from equity investees 575000 406000 223000 546000 372000 93000 567000 405000 135 Net change in produced & licensed content costs & advances 4306000 2279000 507000 3192000 -1685000 771000 148300 925000 136 Net change in operating lease right of use assets / liabilities 127000 146000 36000 16000 -96000 137 Equity-based compensation 723000 450000 196000 428000 70000 34000 388000 246000 138 Pension & postretirement medical benefit cost amoritzation 465000 310000 155000 139 Other adjustments, ne 192000 64000 -7000 728000 90000 90000 471000 156000 40 Receivables 506000 342000 1401000 301000 -37000 1324000 2100000 82800 141 Inventories -259000 -97000 -14000 236000 75000 94000 86000 70000 142 Other assets 684000 676000 -115000 113000 131000 -136000 8000 -174000 143 Accounts payable & other liabilities 892000 1349000 2579000 341000 780000 $4200 1986000 888000 144 Income taxes 15000 650000 566000 260000 400000 60000 95000 112000 145 Net cash flows from operations - continuing operations 3478000 -209000 5949000 4787000 146 Net cash flows from operating activities 3478000 1556000 -209000 2934000 1468000 '5000 5949000 147 Investments in parks, resorts & other property 3795000 2060000 981000 246800 1530000 760000 3293000 2585000 148 Other investing activities, net -77000 3600 -6000 383000 203000 28000 -27000 -21000 149 Net cash flows from investing activities - continuing operations -3872000 987000 3320000 2606000 150 Net cash flows from investing activities -3872000 2024000 -987000 2085000 -1327000 -732000 3320000 151 Commercial paper borrowings (payments), net -275000 130000 124000 9900 -87000 179000 1373000 3138000 152 Borrowings 152000 70000 33000 43000 37000 100 18030000 5071000 153 Reduction of borrowings -1400000 -1400000 2319000 1816000 -139000 -2297000 1048000 154 Dividends 1587000 1587000 155 Proceeds from exercise of stock options 100000 88000 33000 405000 39400 209000 238000 207000 156 Other financing activities, net -824000 725000 222000 801000 769000 225000 -838000 165000 157 Net cash flows from financing activities - continuing operations -2247000 280000 14919000 $616000 158 Net cash flows from financing activities -2247000 2097000 280000 277100 -2241000 -333000 491900 59 Net cash flows from operating activities - discontinued operations 8000 8000 8000 -2000 4000 2000 4000 160 Net cash flows from investing activities - discontinued operations 8000 4000 98000 198000 161 Net cash flows from financing activities - discontinued operations 1200 -12000 -12000 162 Cash flows from operations - discontinued operations 4000 4000 -4000 6000 8000 9000 00000 202000 63 Impact of exchange rates on cash, cash equivalents & restricted 54000 116000 -35000 77000 70000 39000 -49000 -76000 164 Change in cash, cash equivalents & restricted cash -2999000 268500 -1515000 -1839000 -2022000 -842000 7699000 923000 165 Cash, cash equivalents & restricted cash, beginning of period 1600300 16003000 16003000 17954000 17954000 17954000 5455000 5455000 166 Cash, cash equivalents & restricted cash, end of period 13004000 13318000 14488000 161 15000 15932000 17112000 23154000 14378000 167 168 169 170 171 172 173 174 175 176 177 178 179 180 104 D asreported + Ready Accessibility: Good to go + 100%