Question: AutoSave ... w HW 4 2023 - Compatibility Mode - Saved to my Mac Home Insert Draw Design Layout References Mailings Review View Tell me
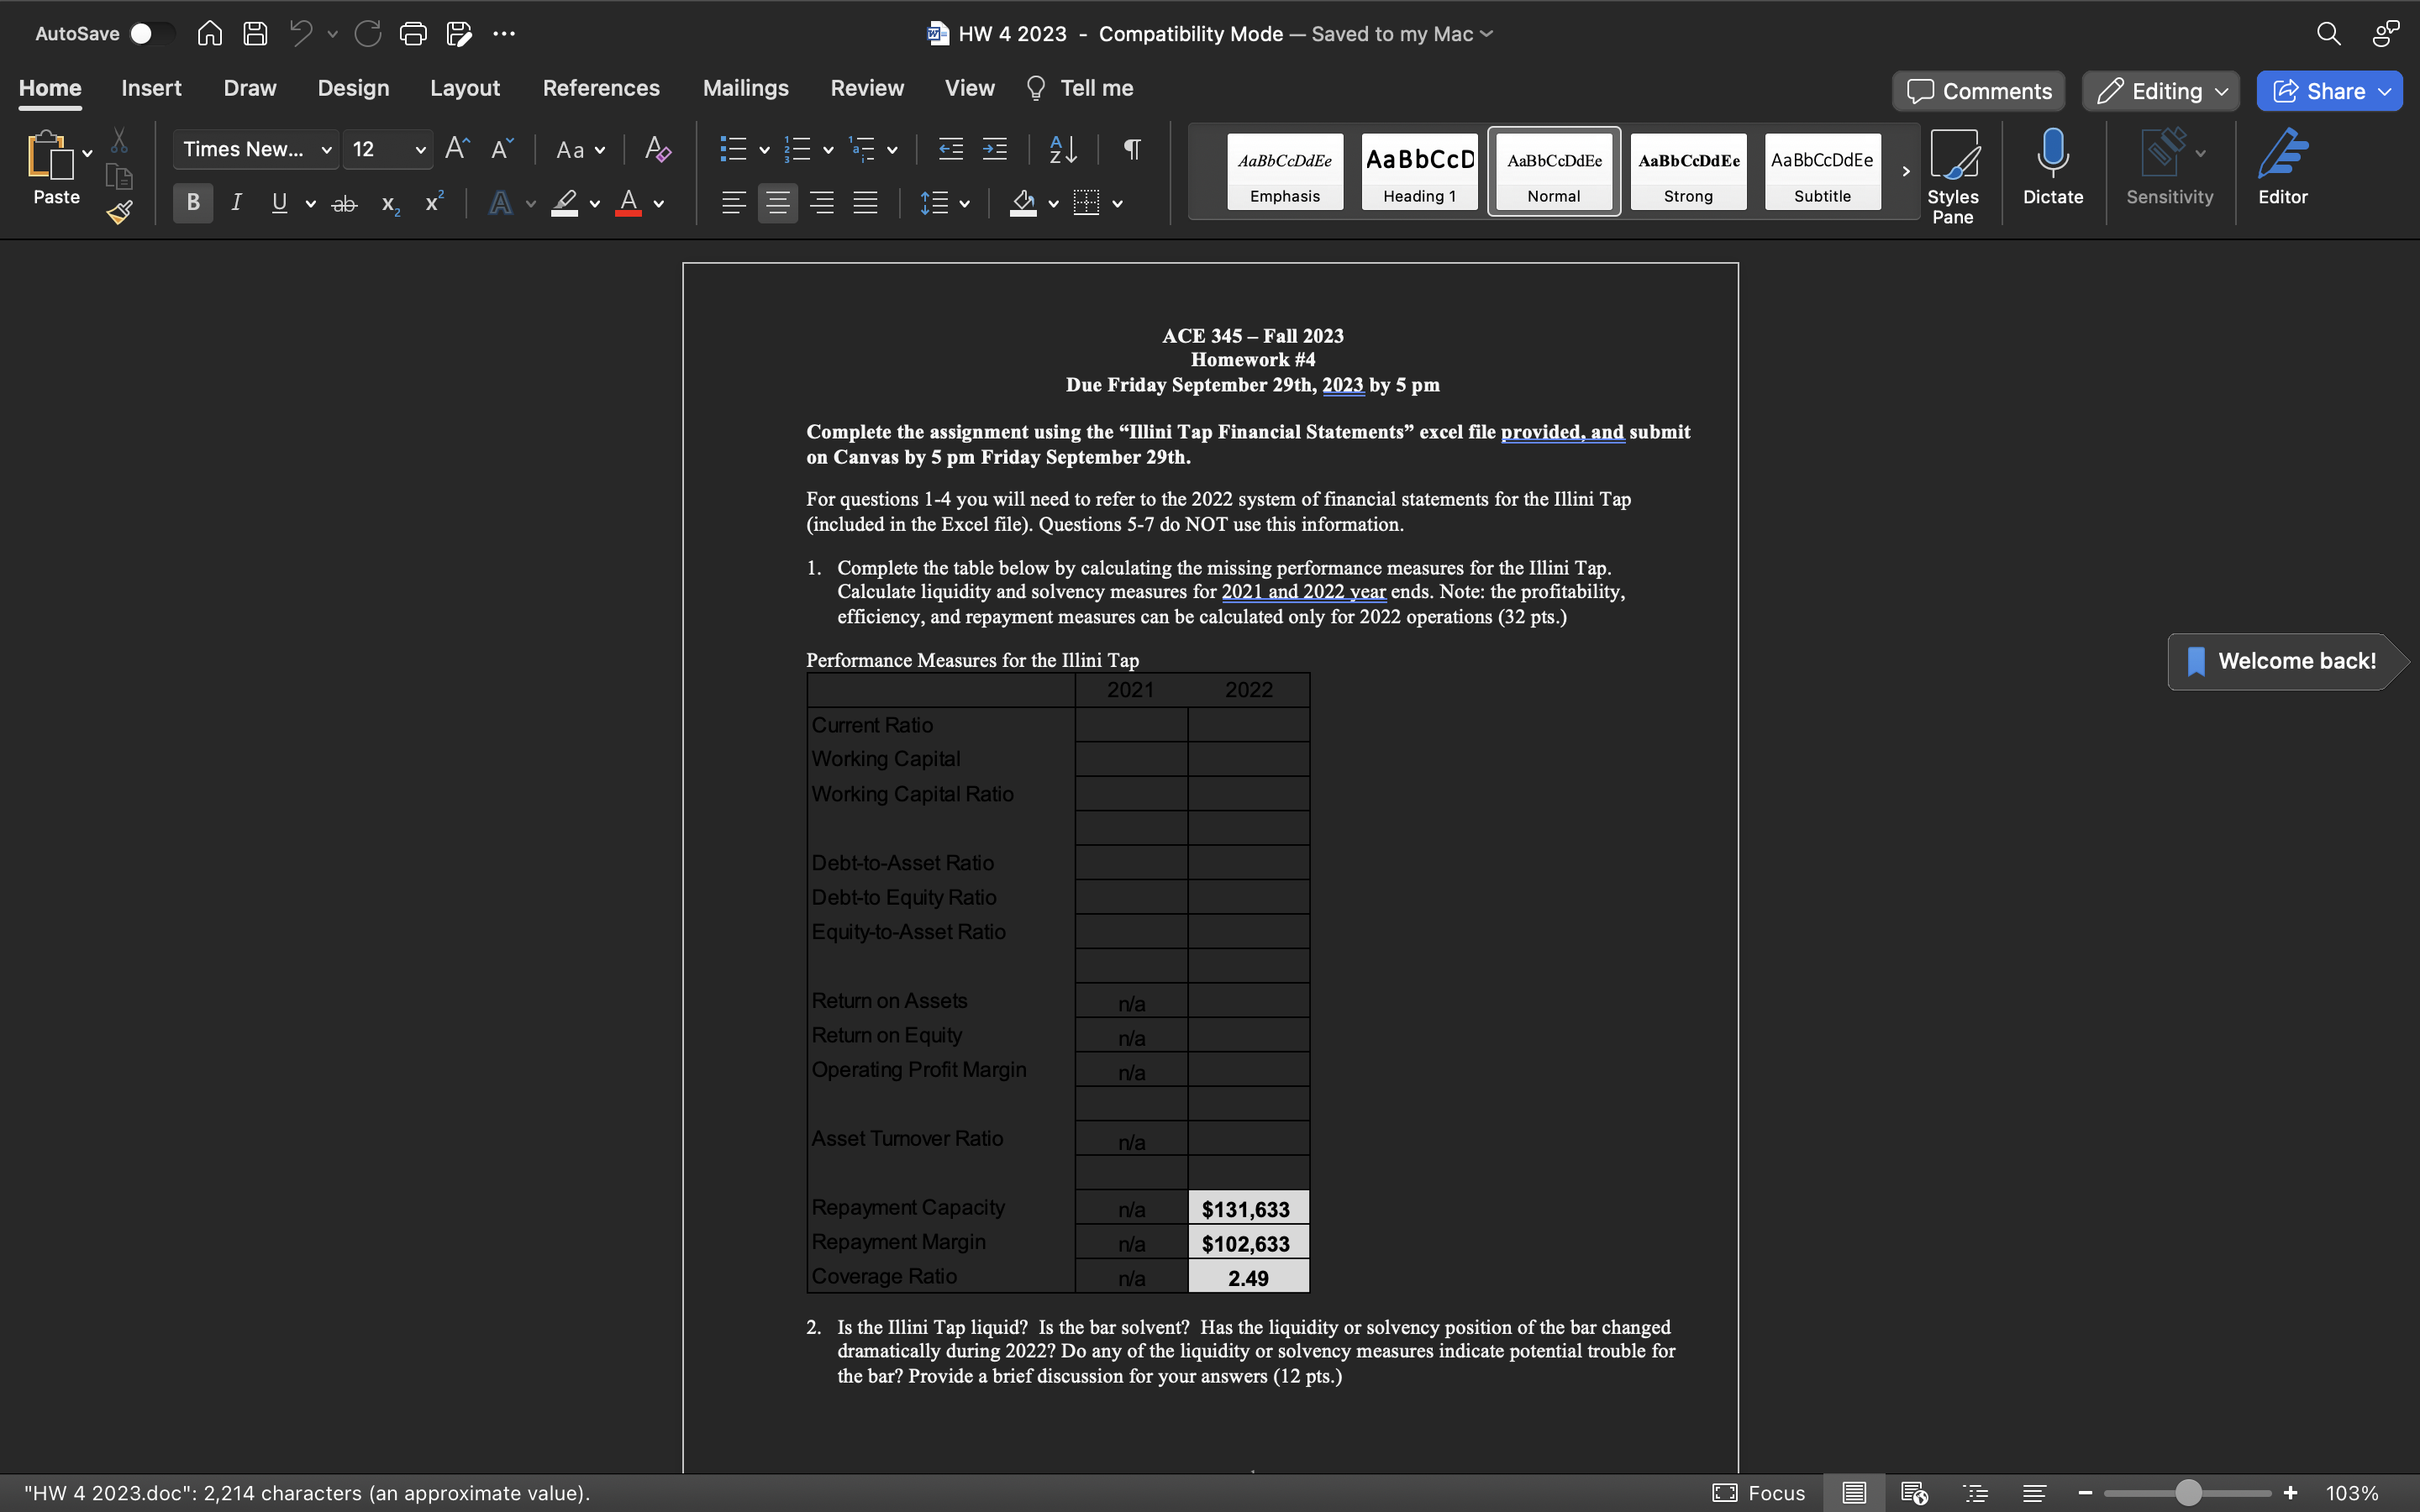
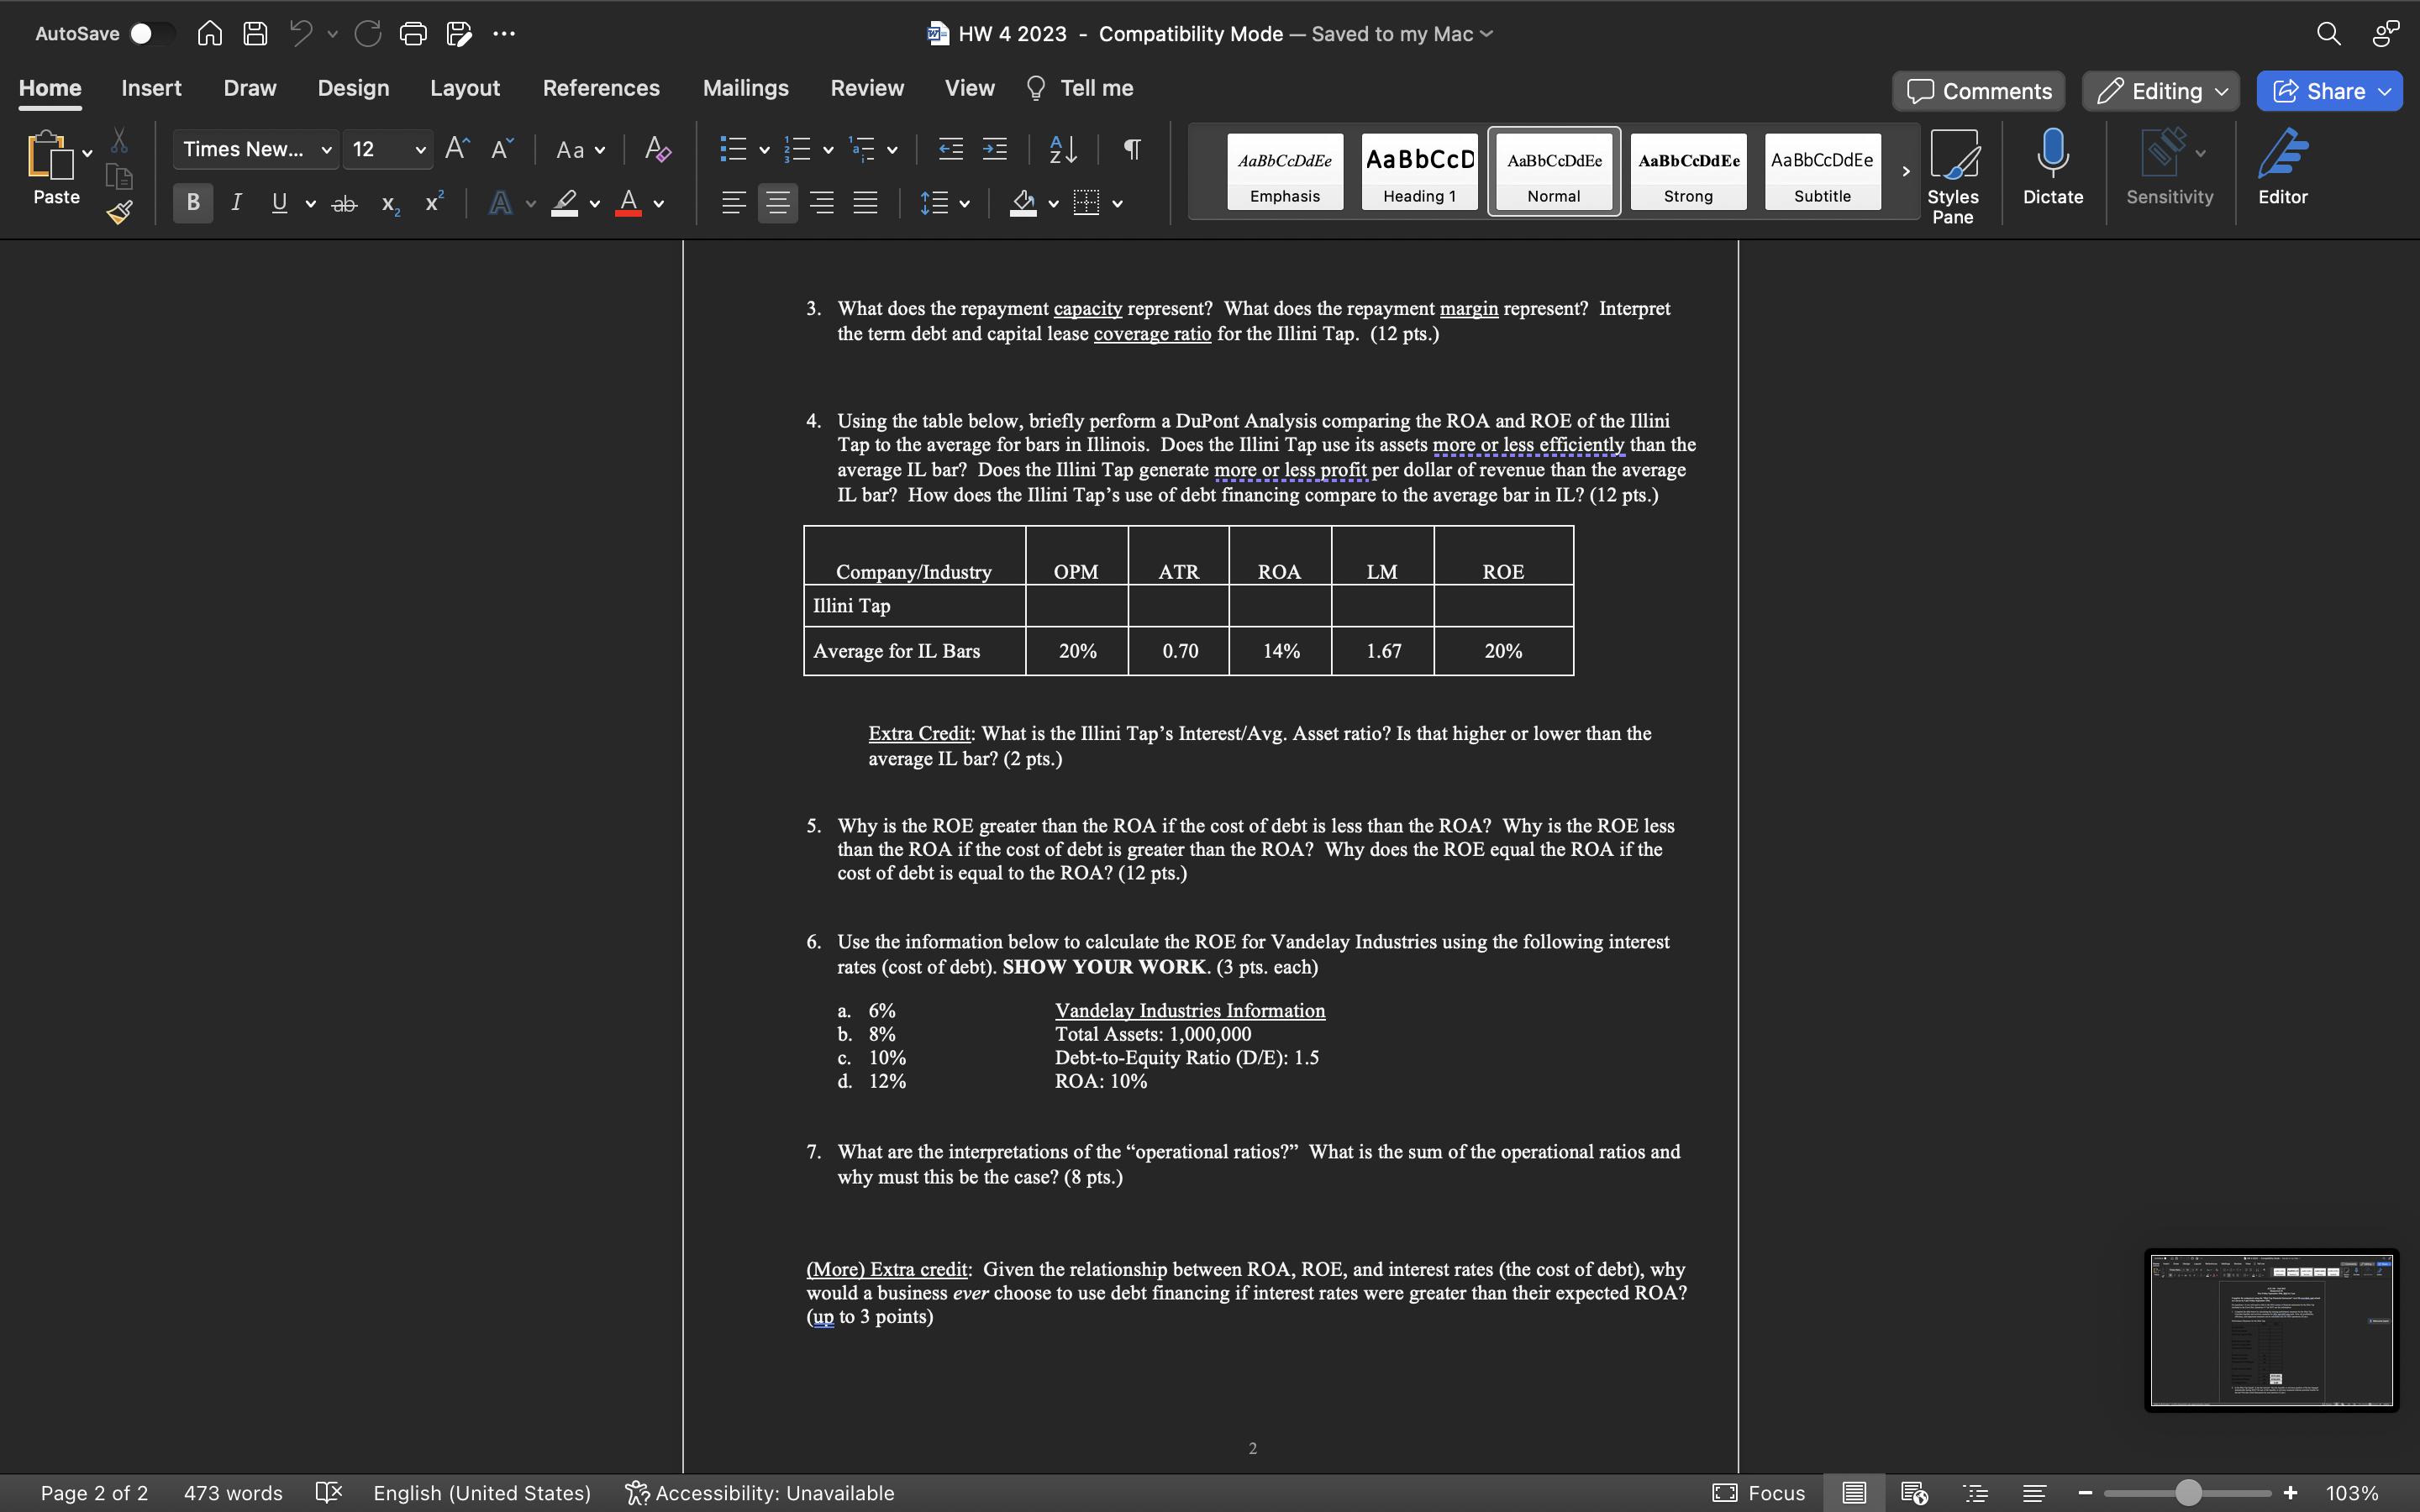
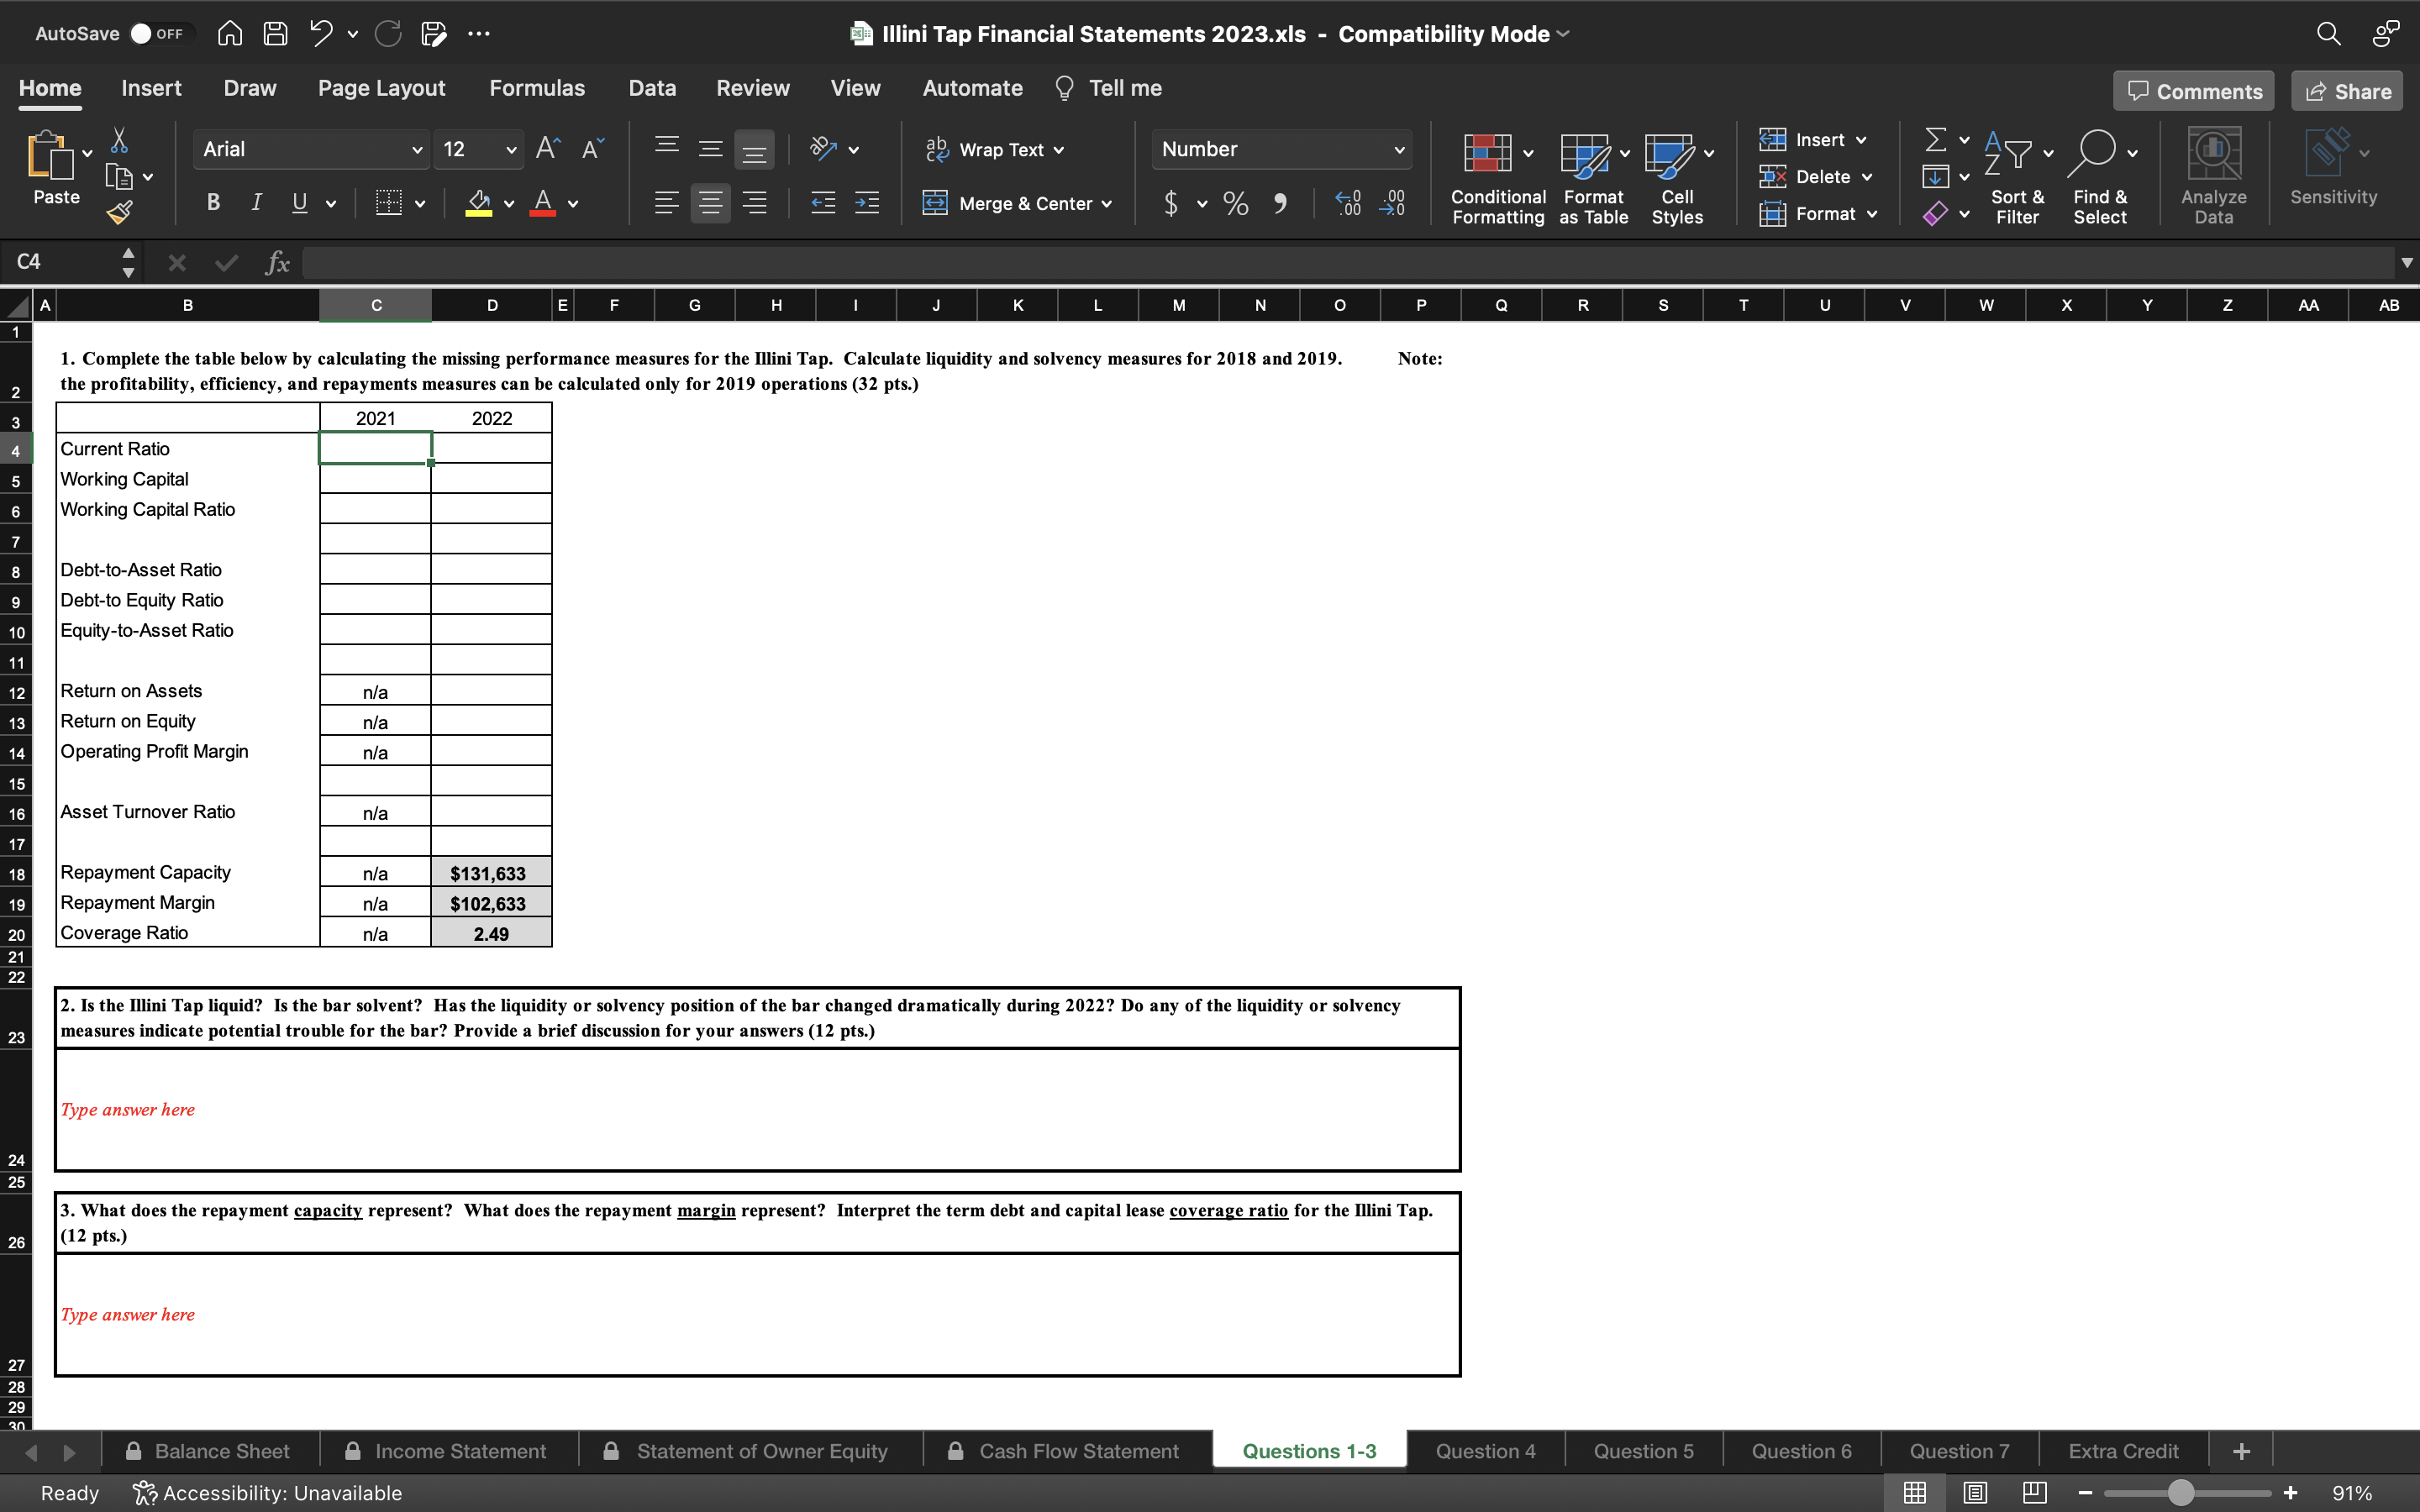
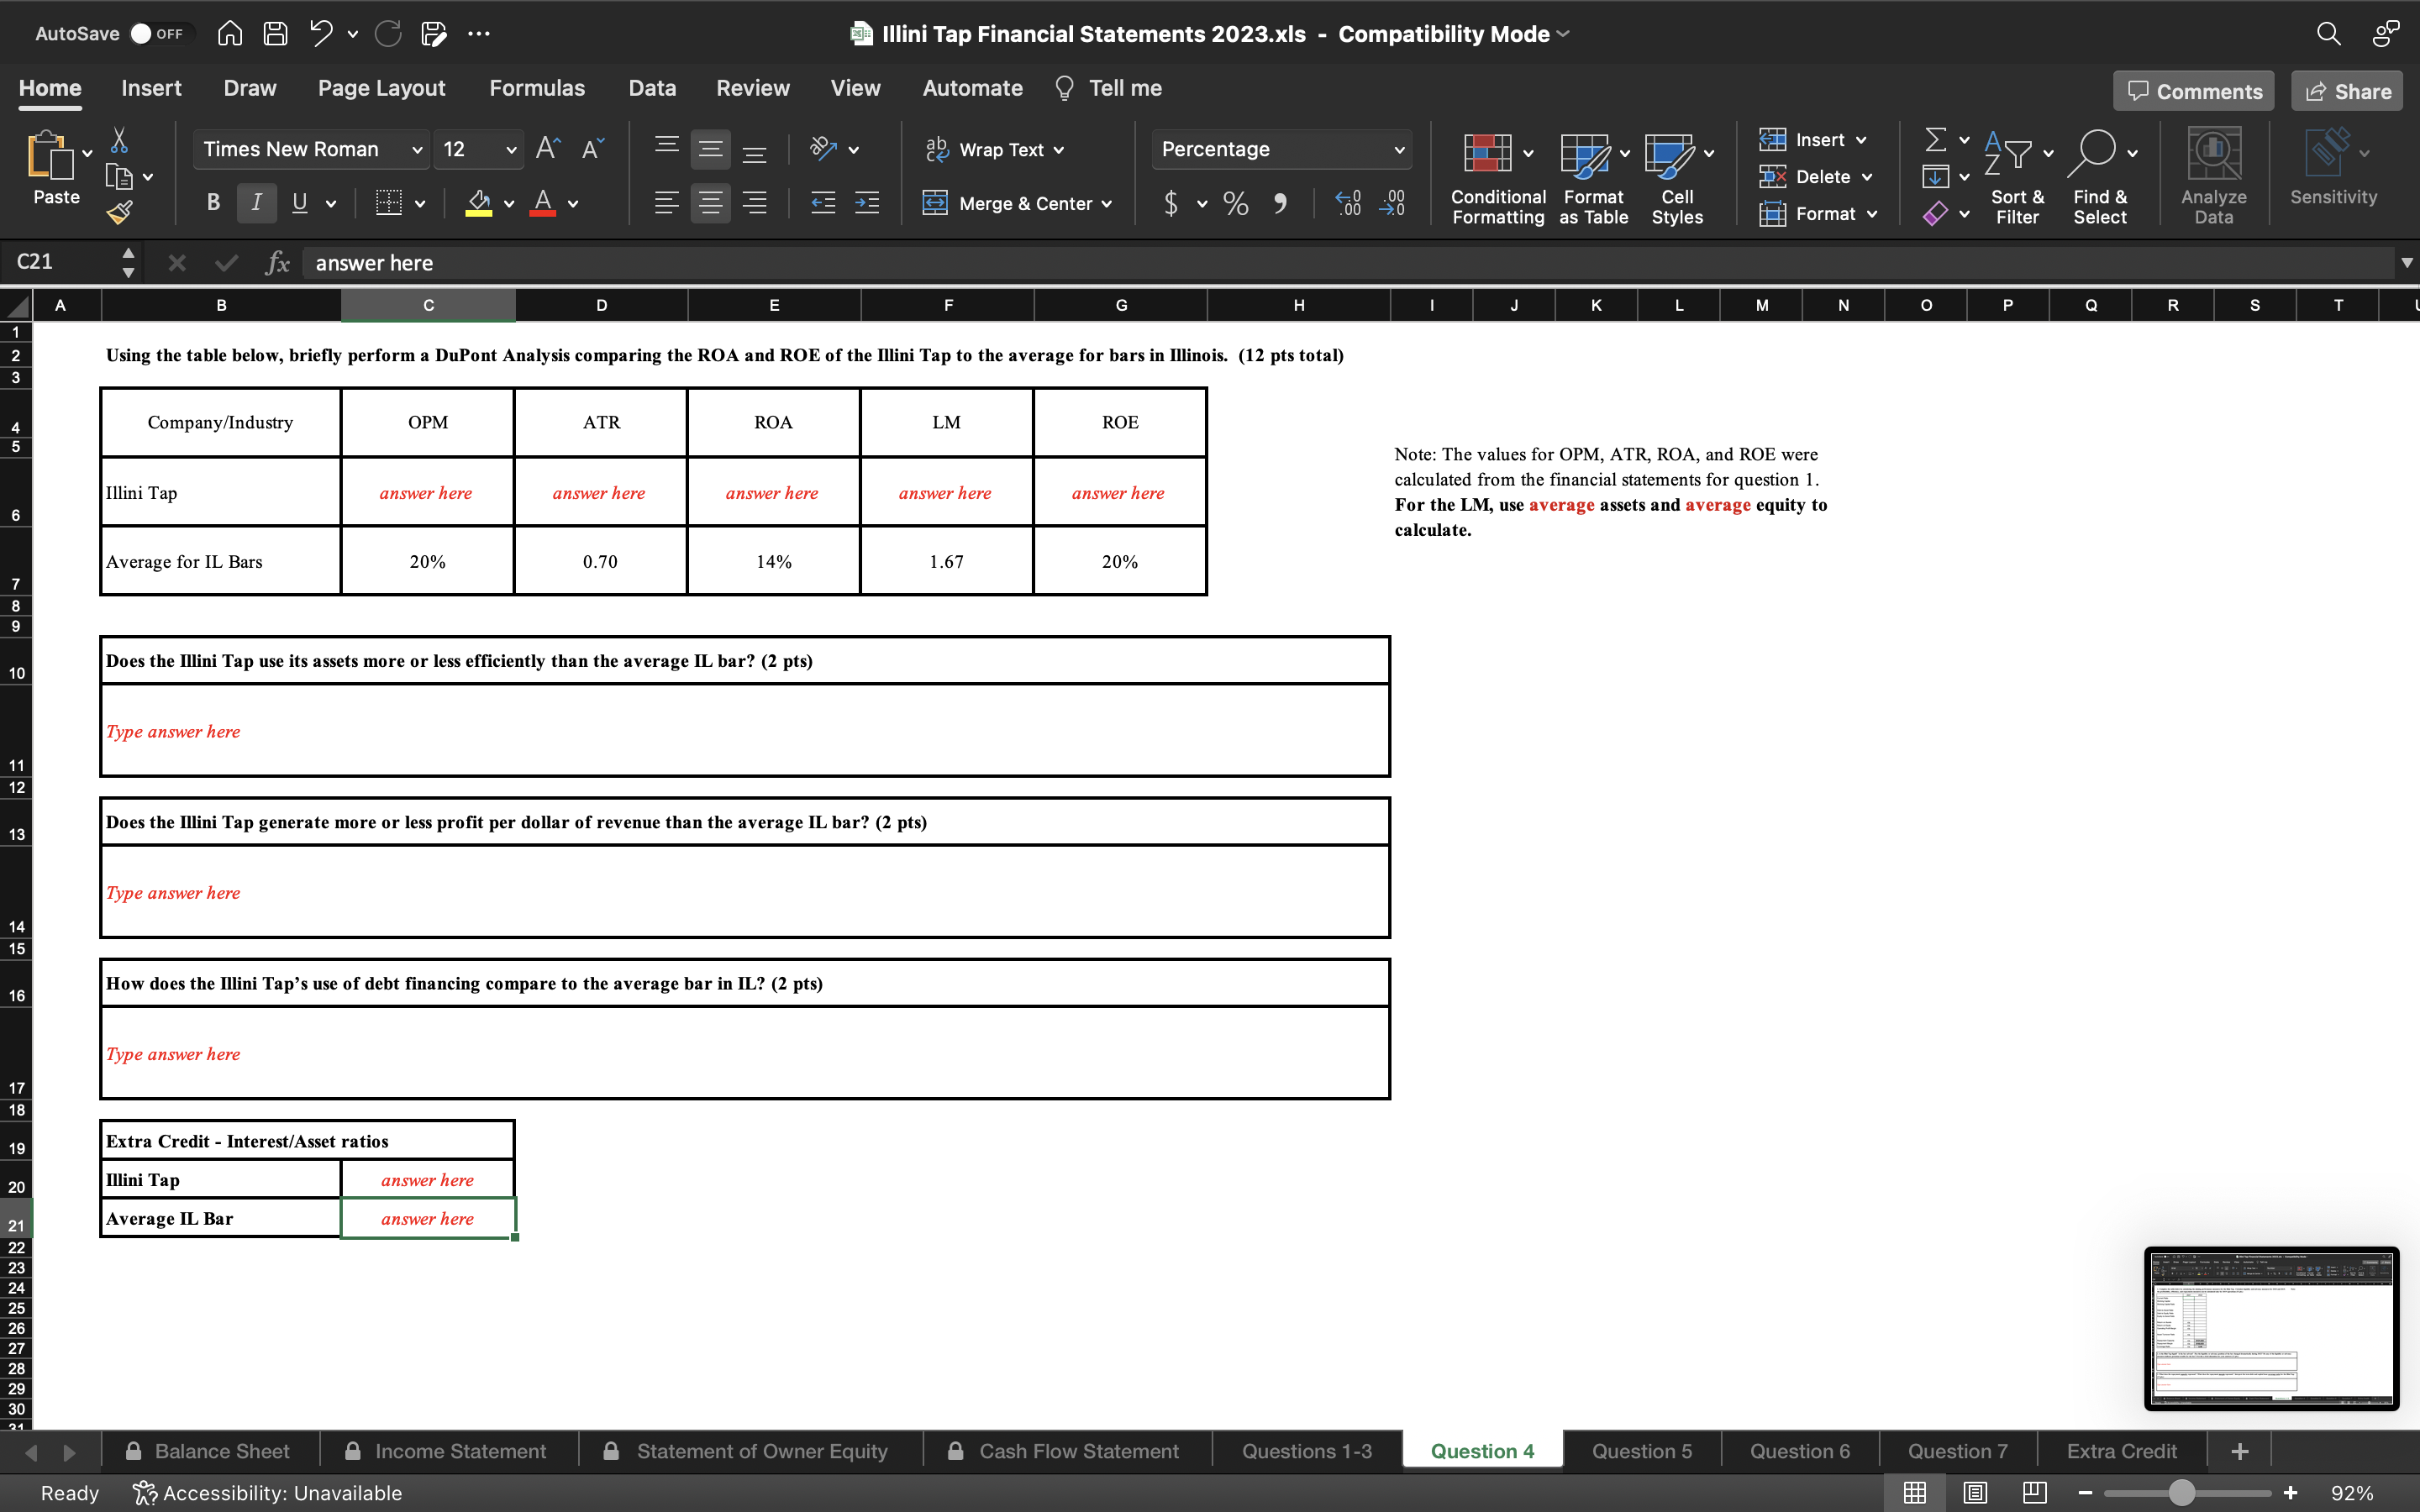
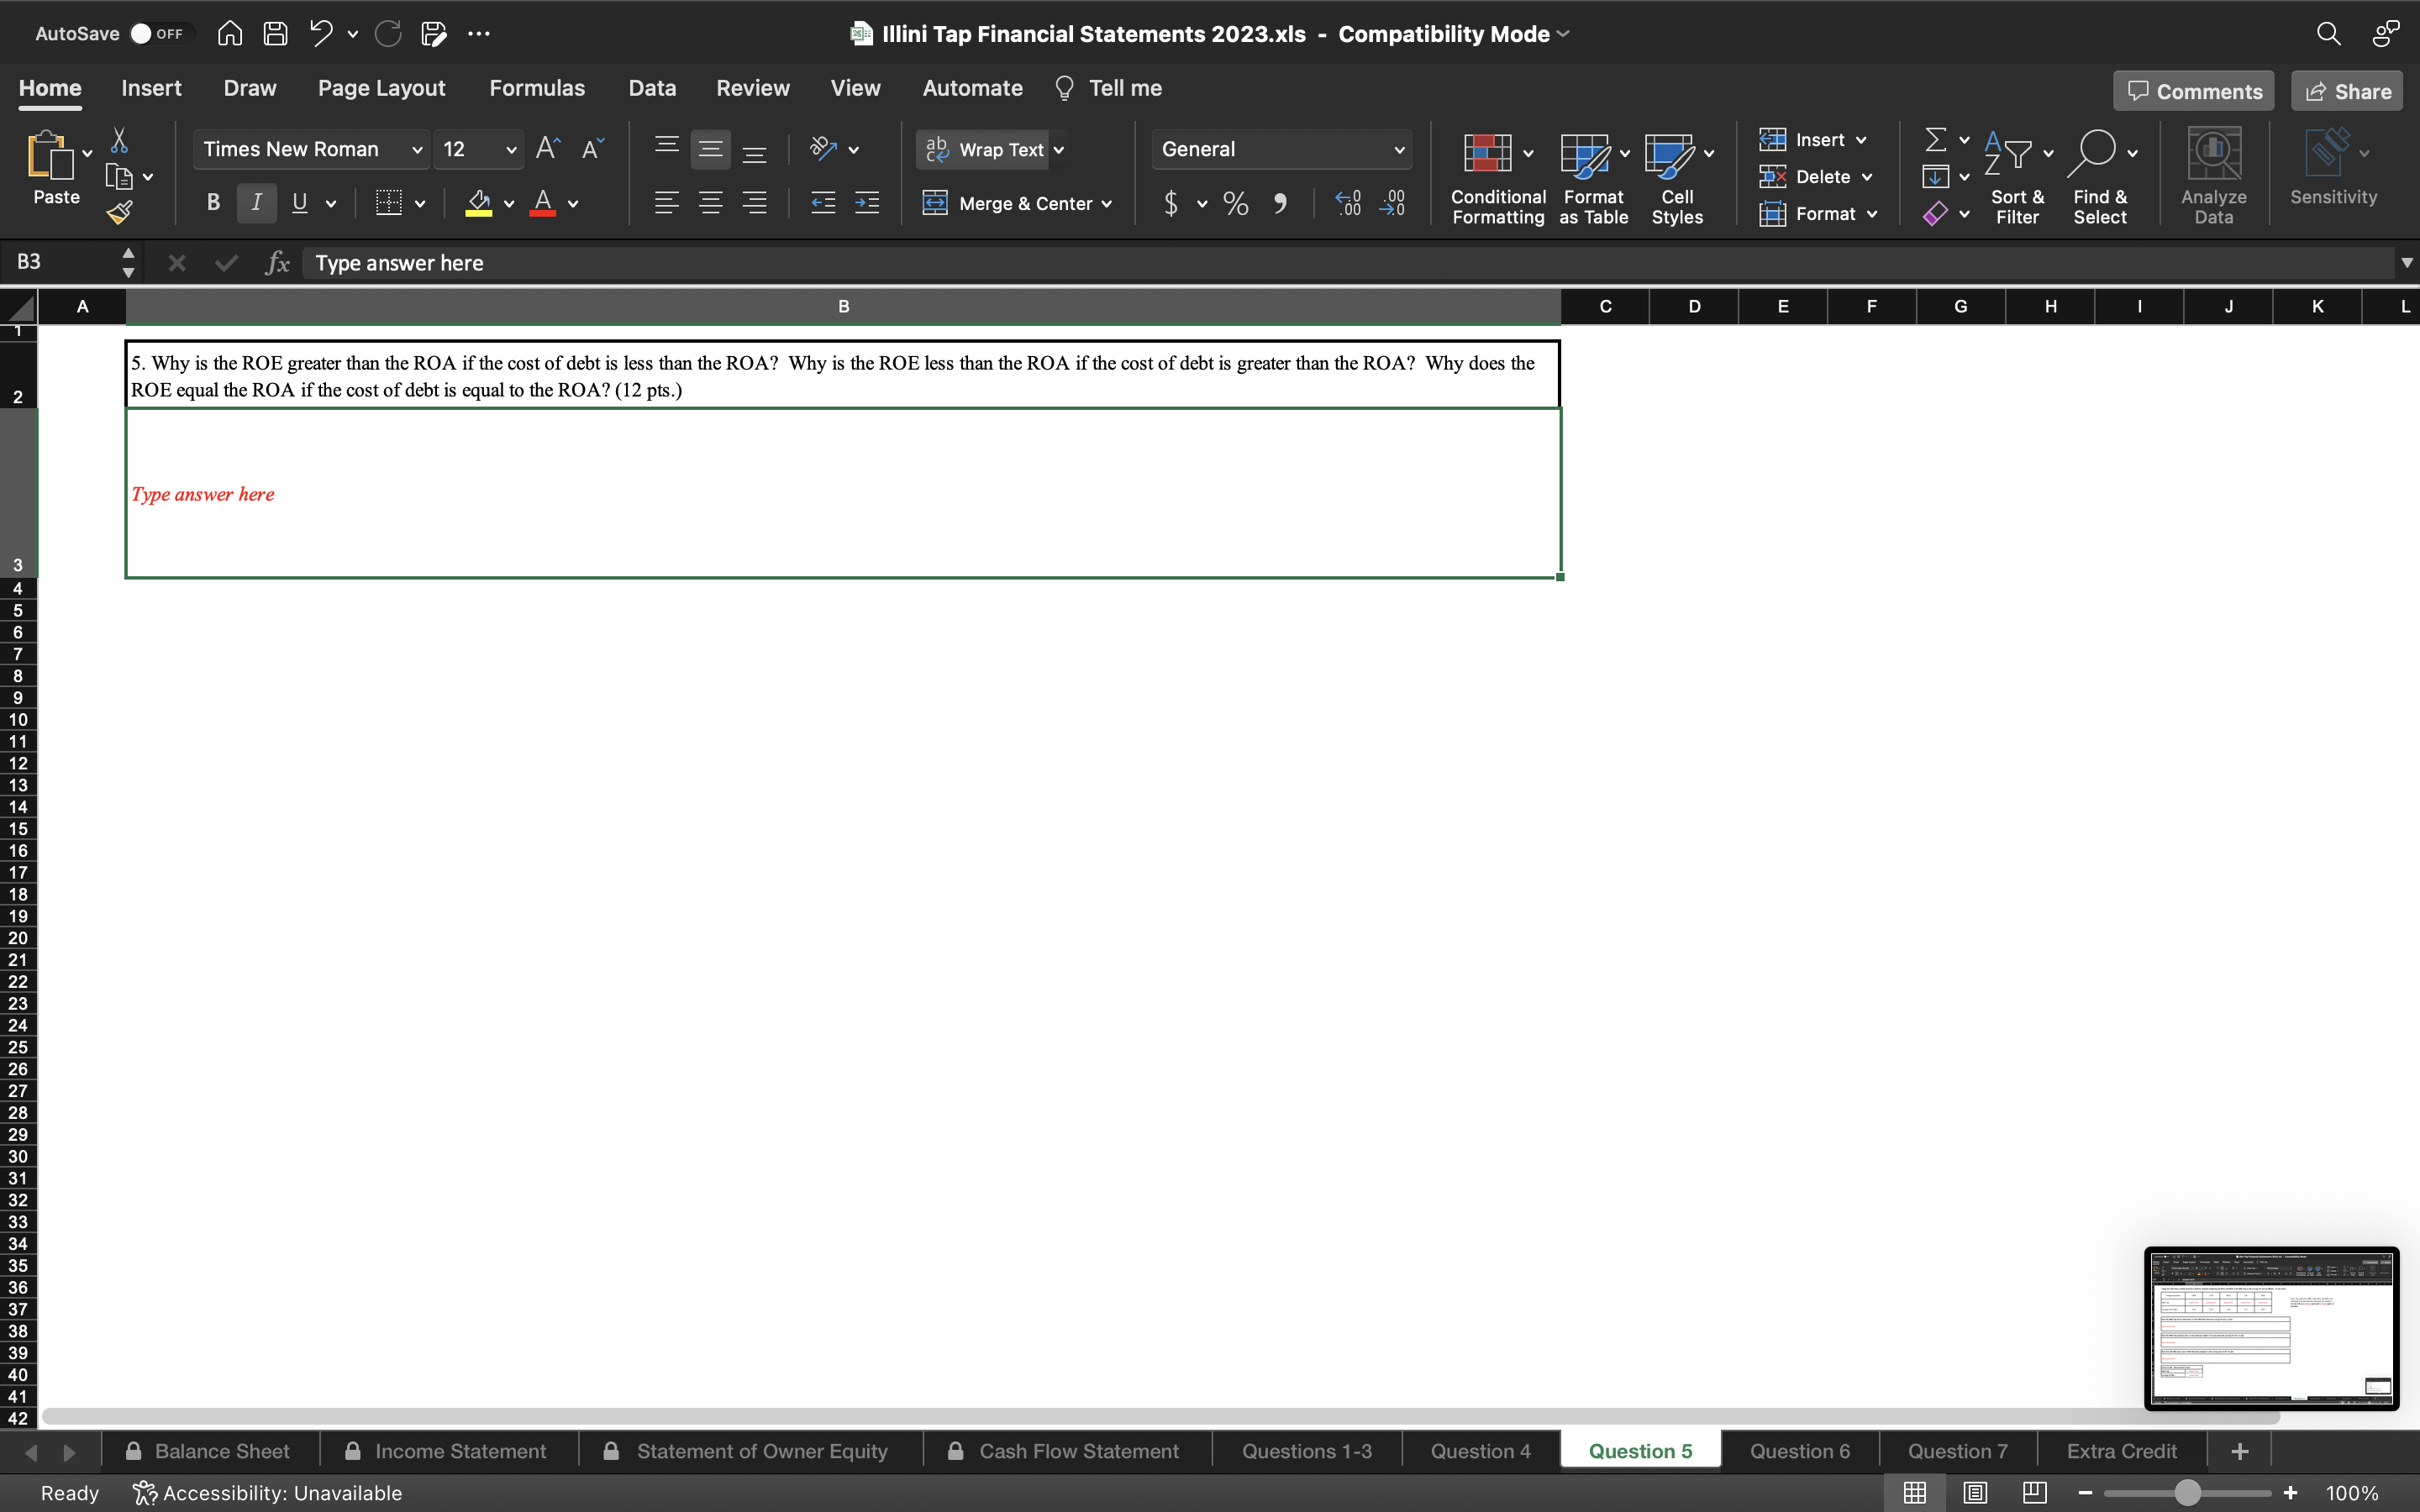
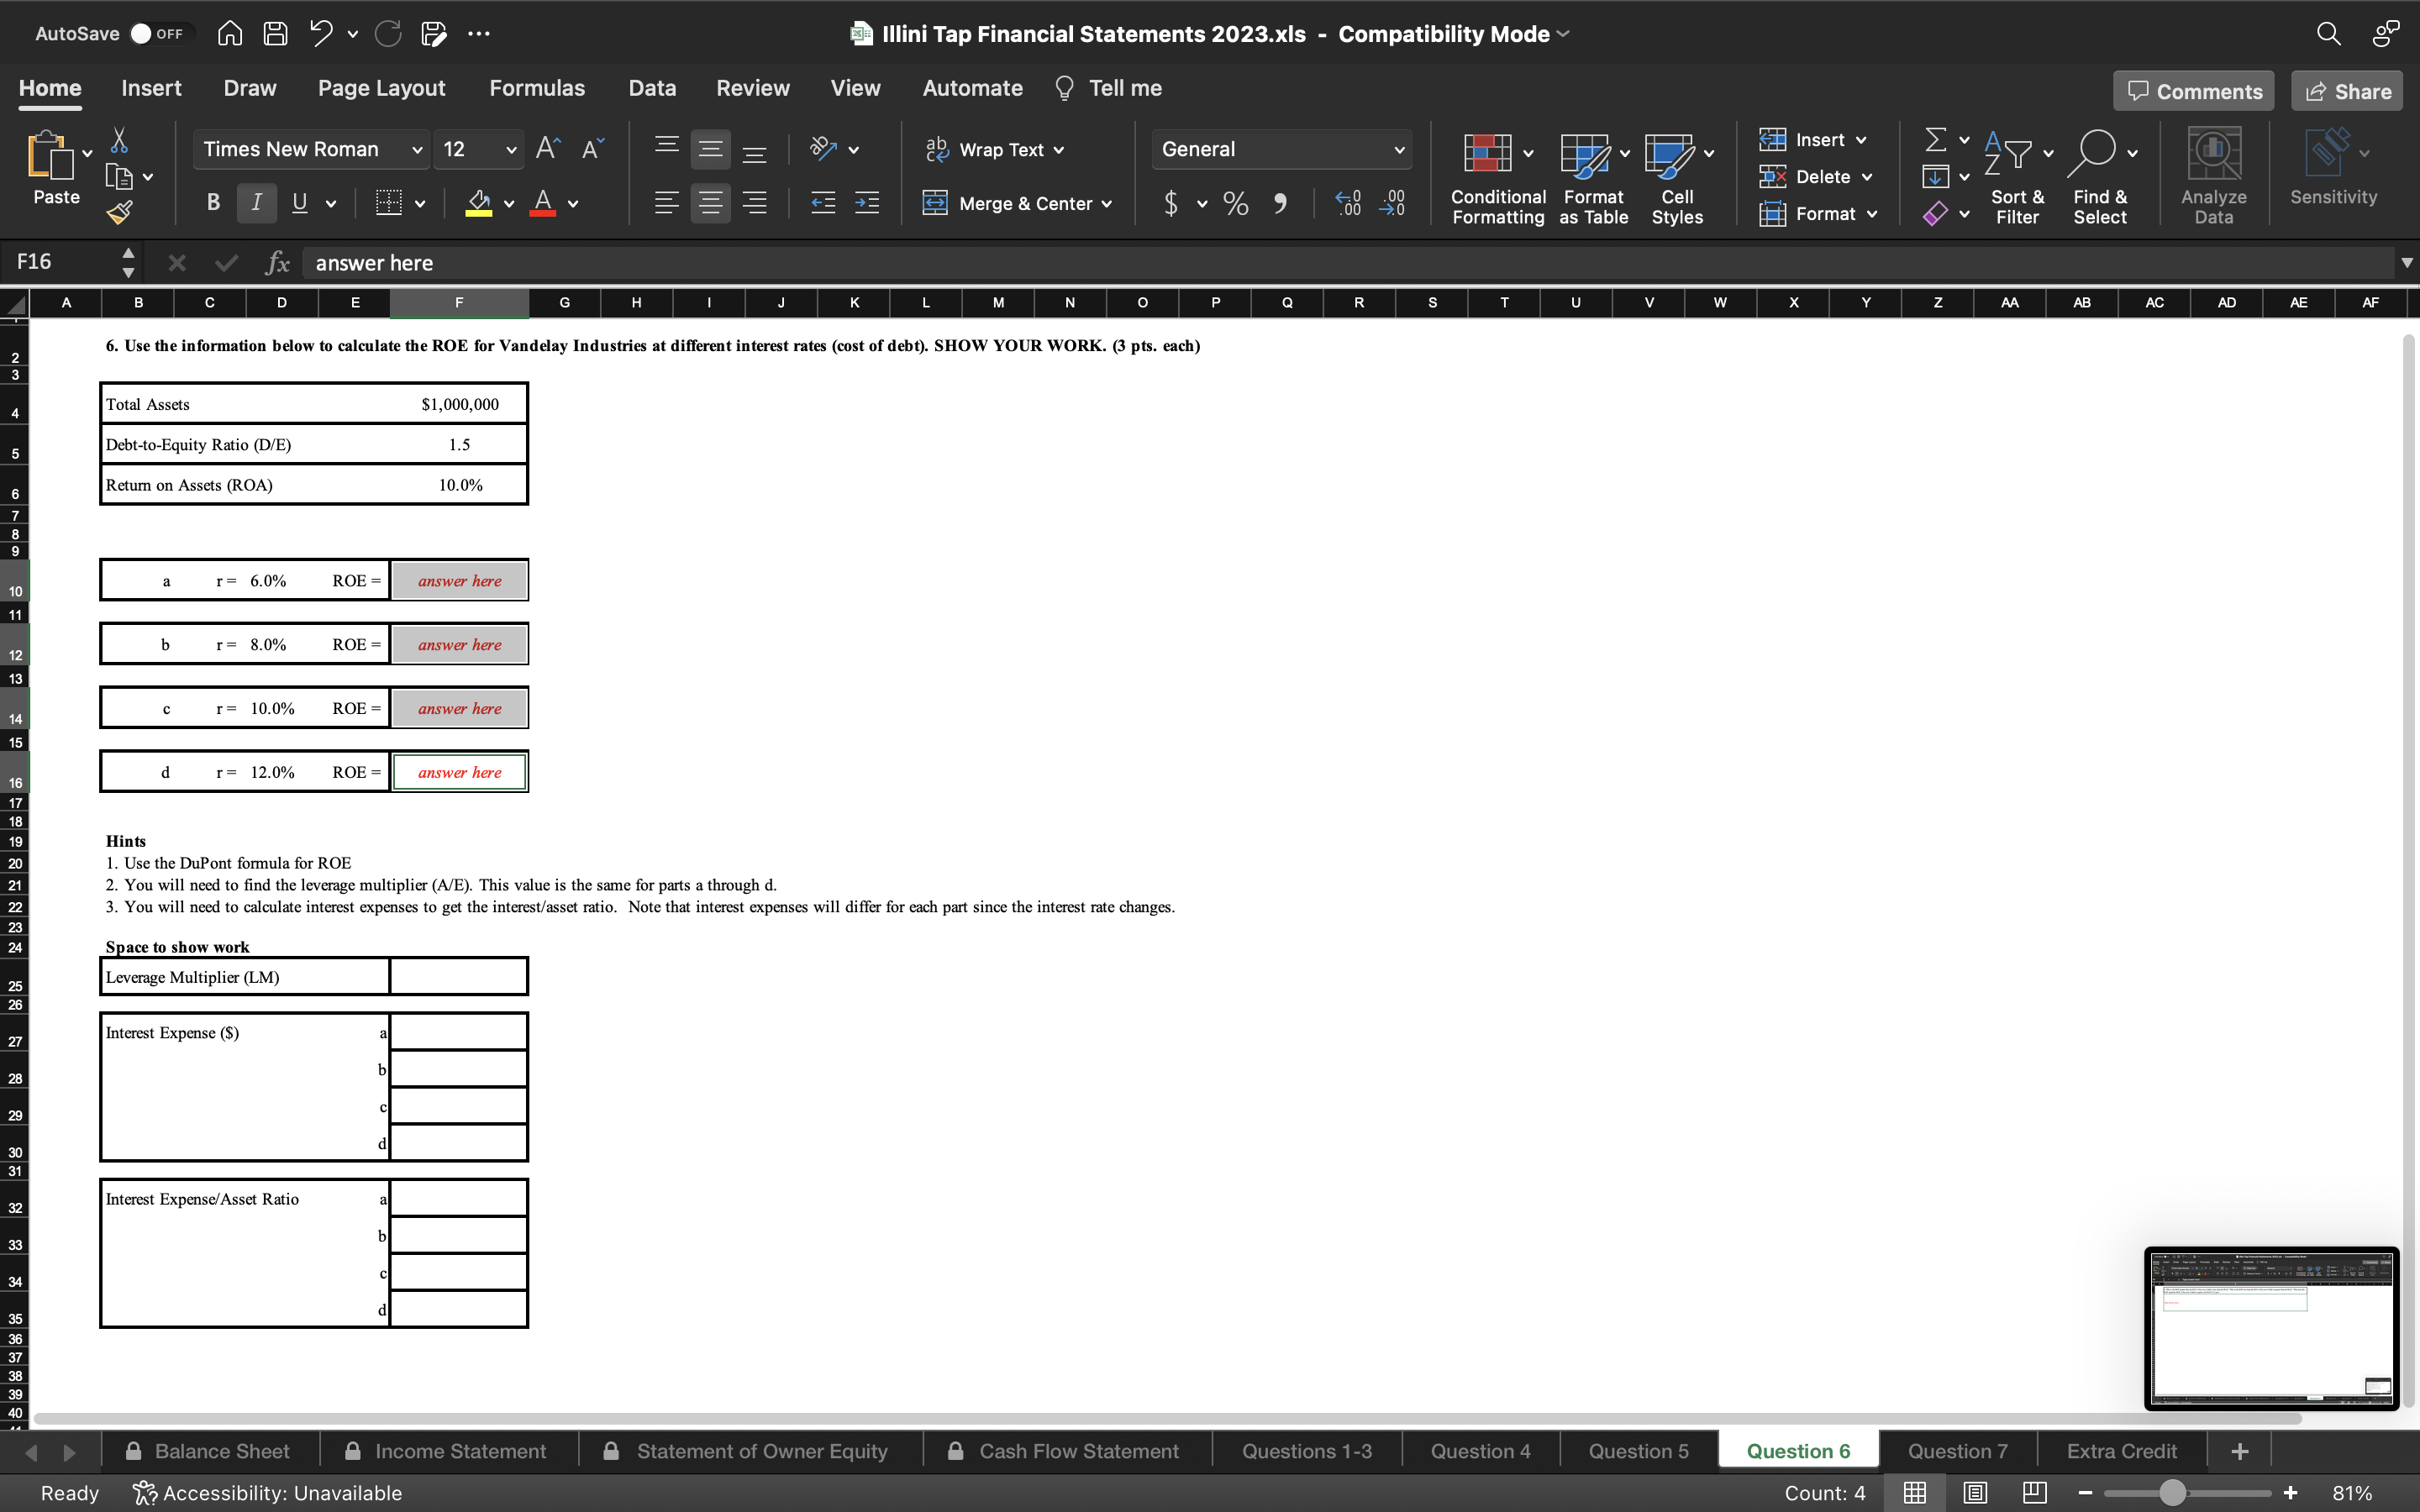
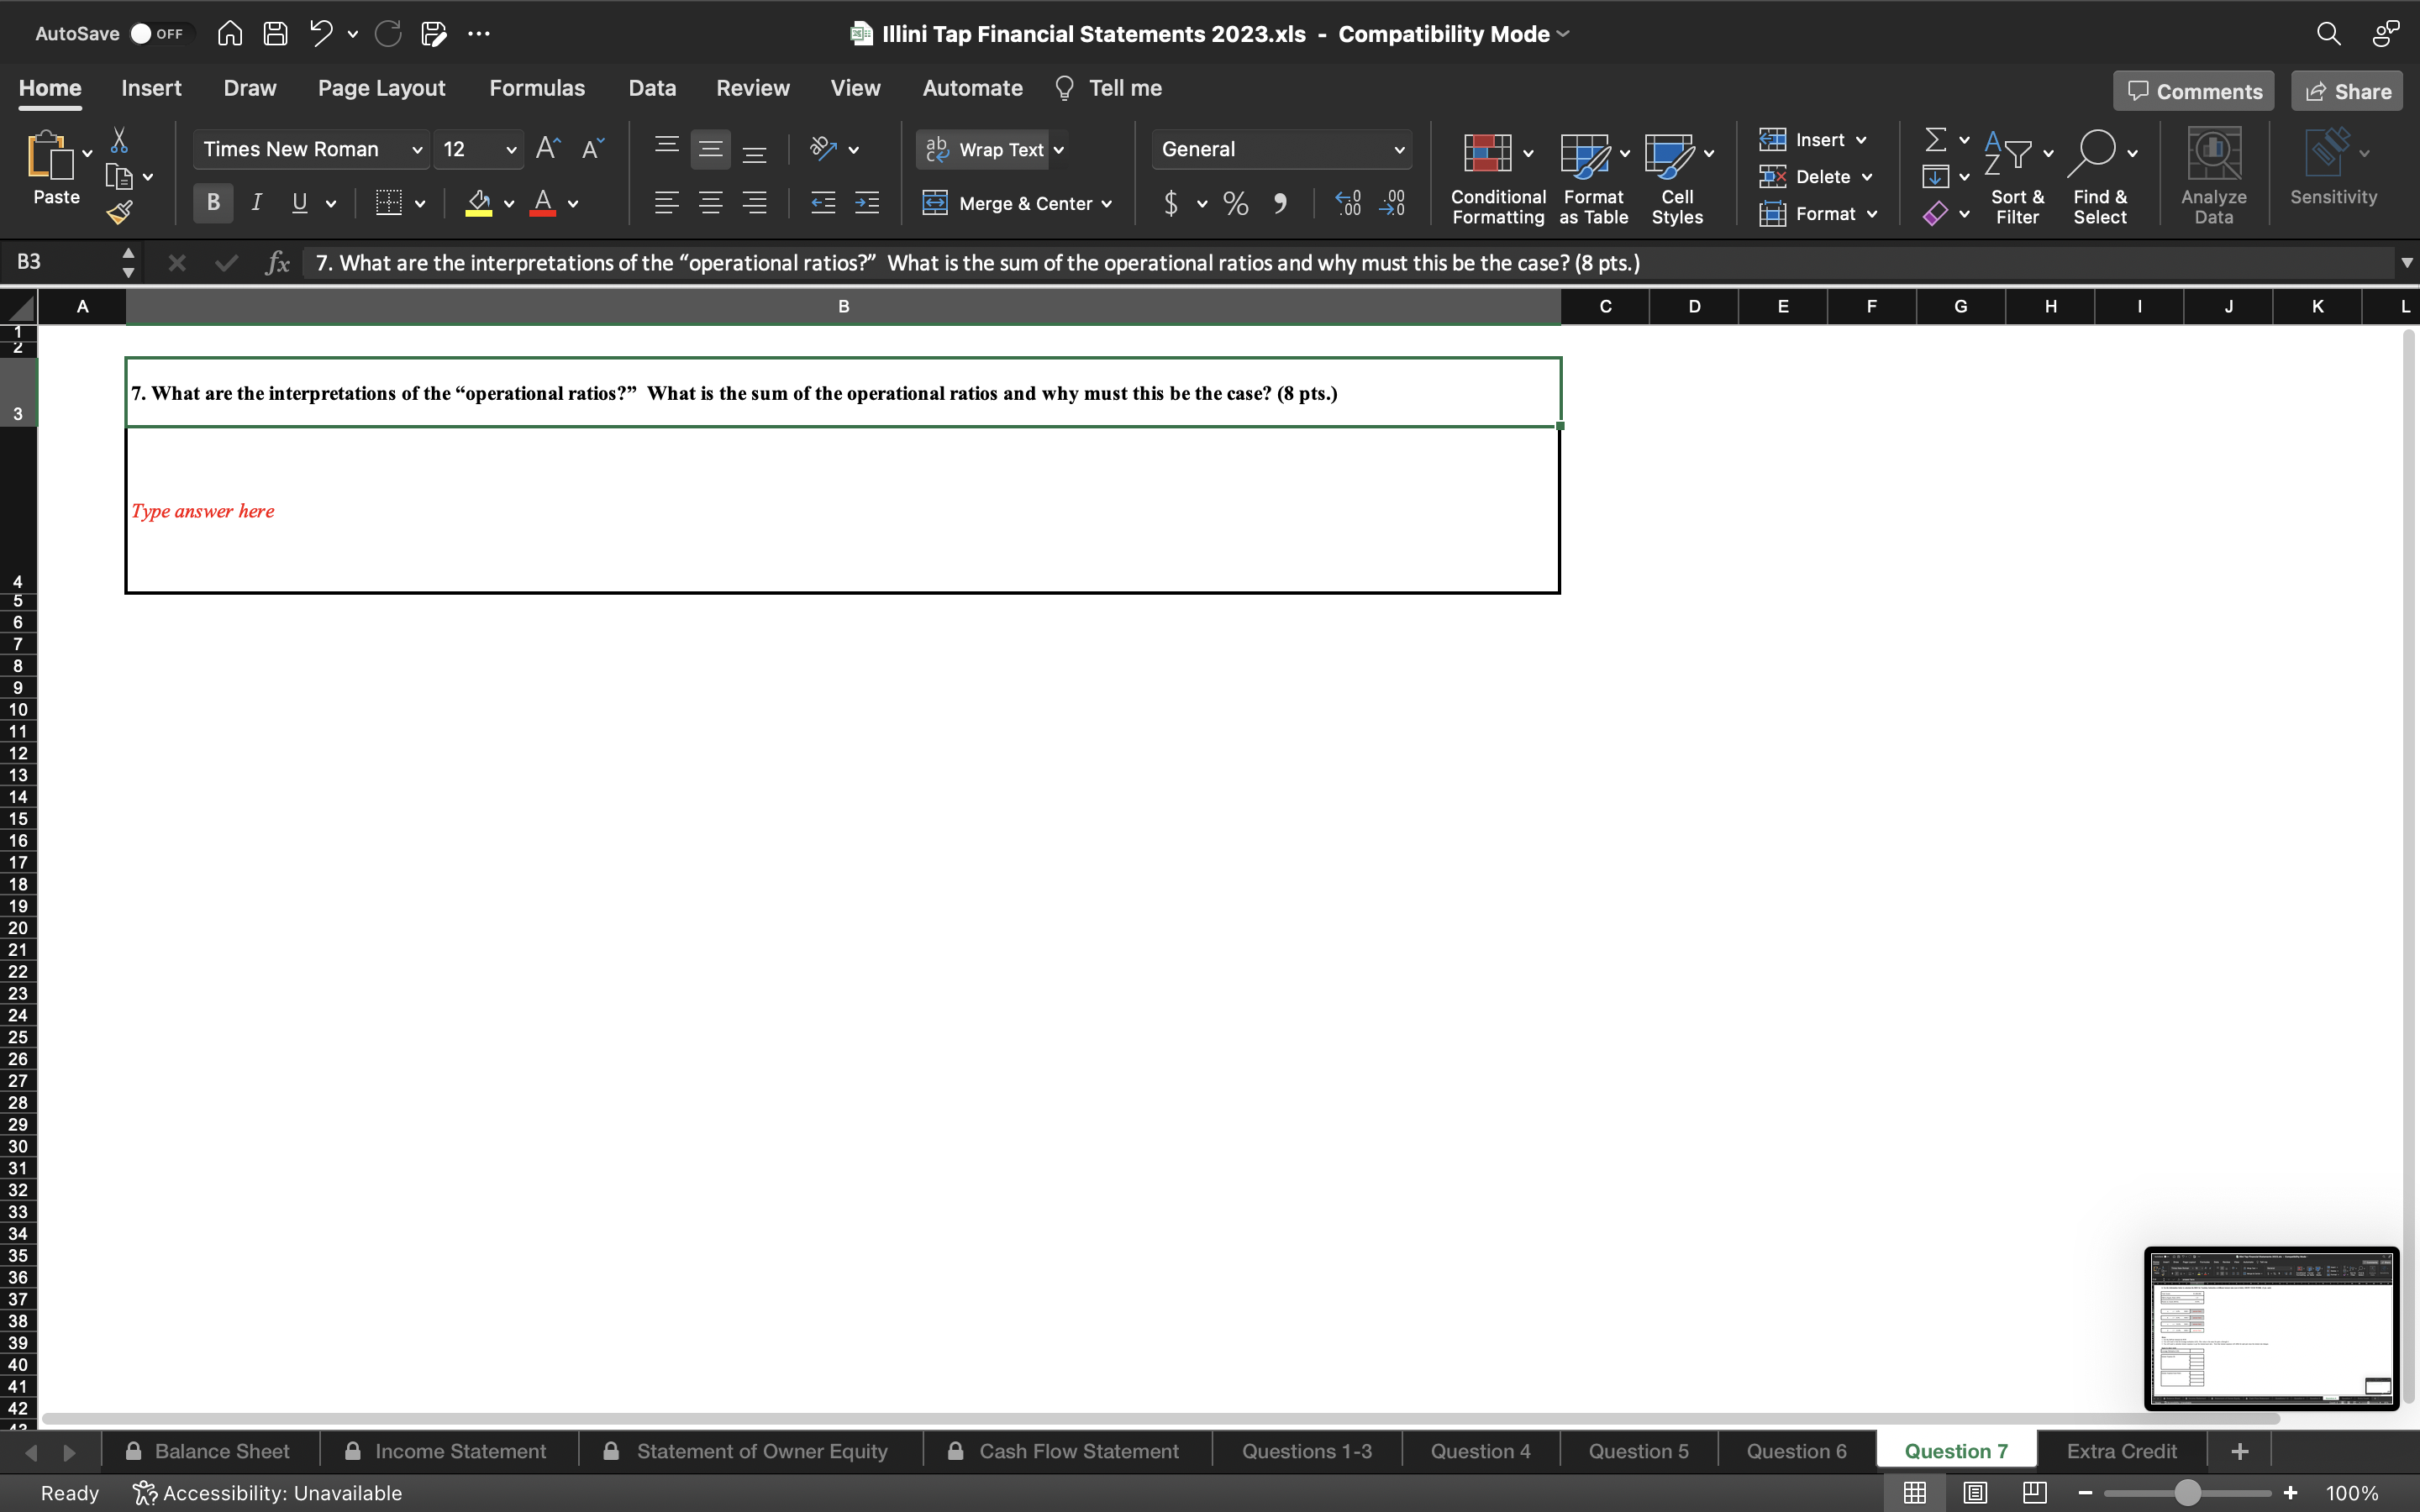
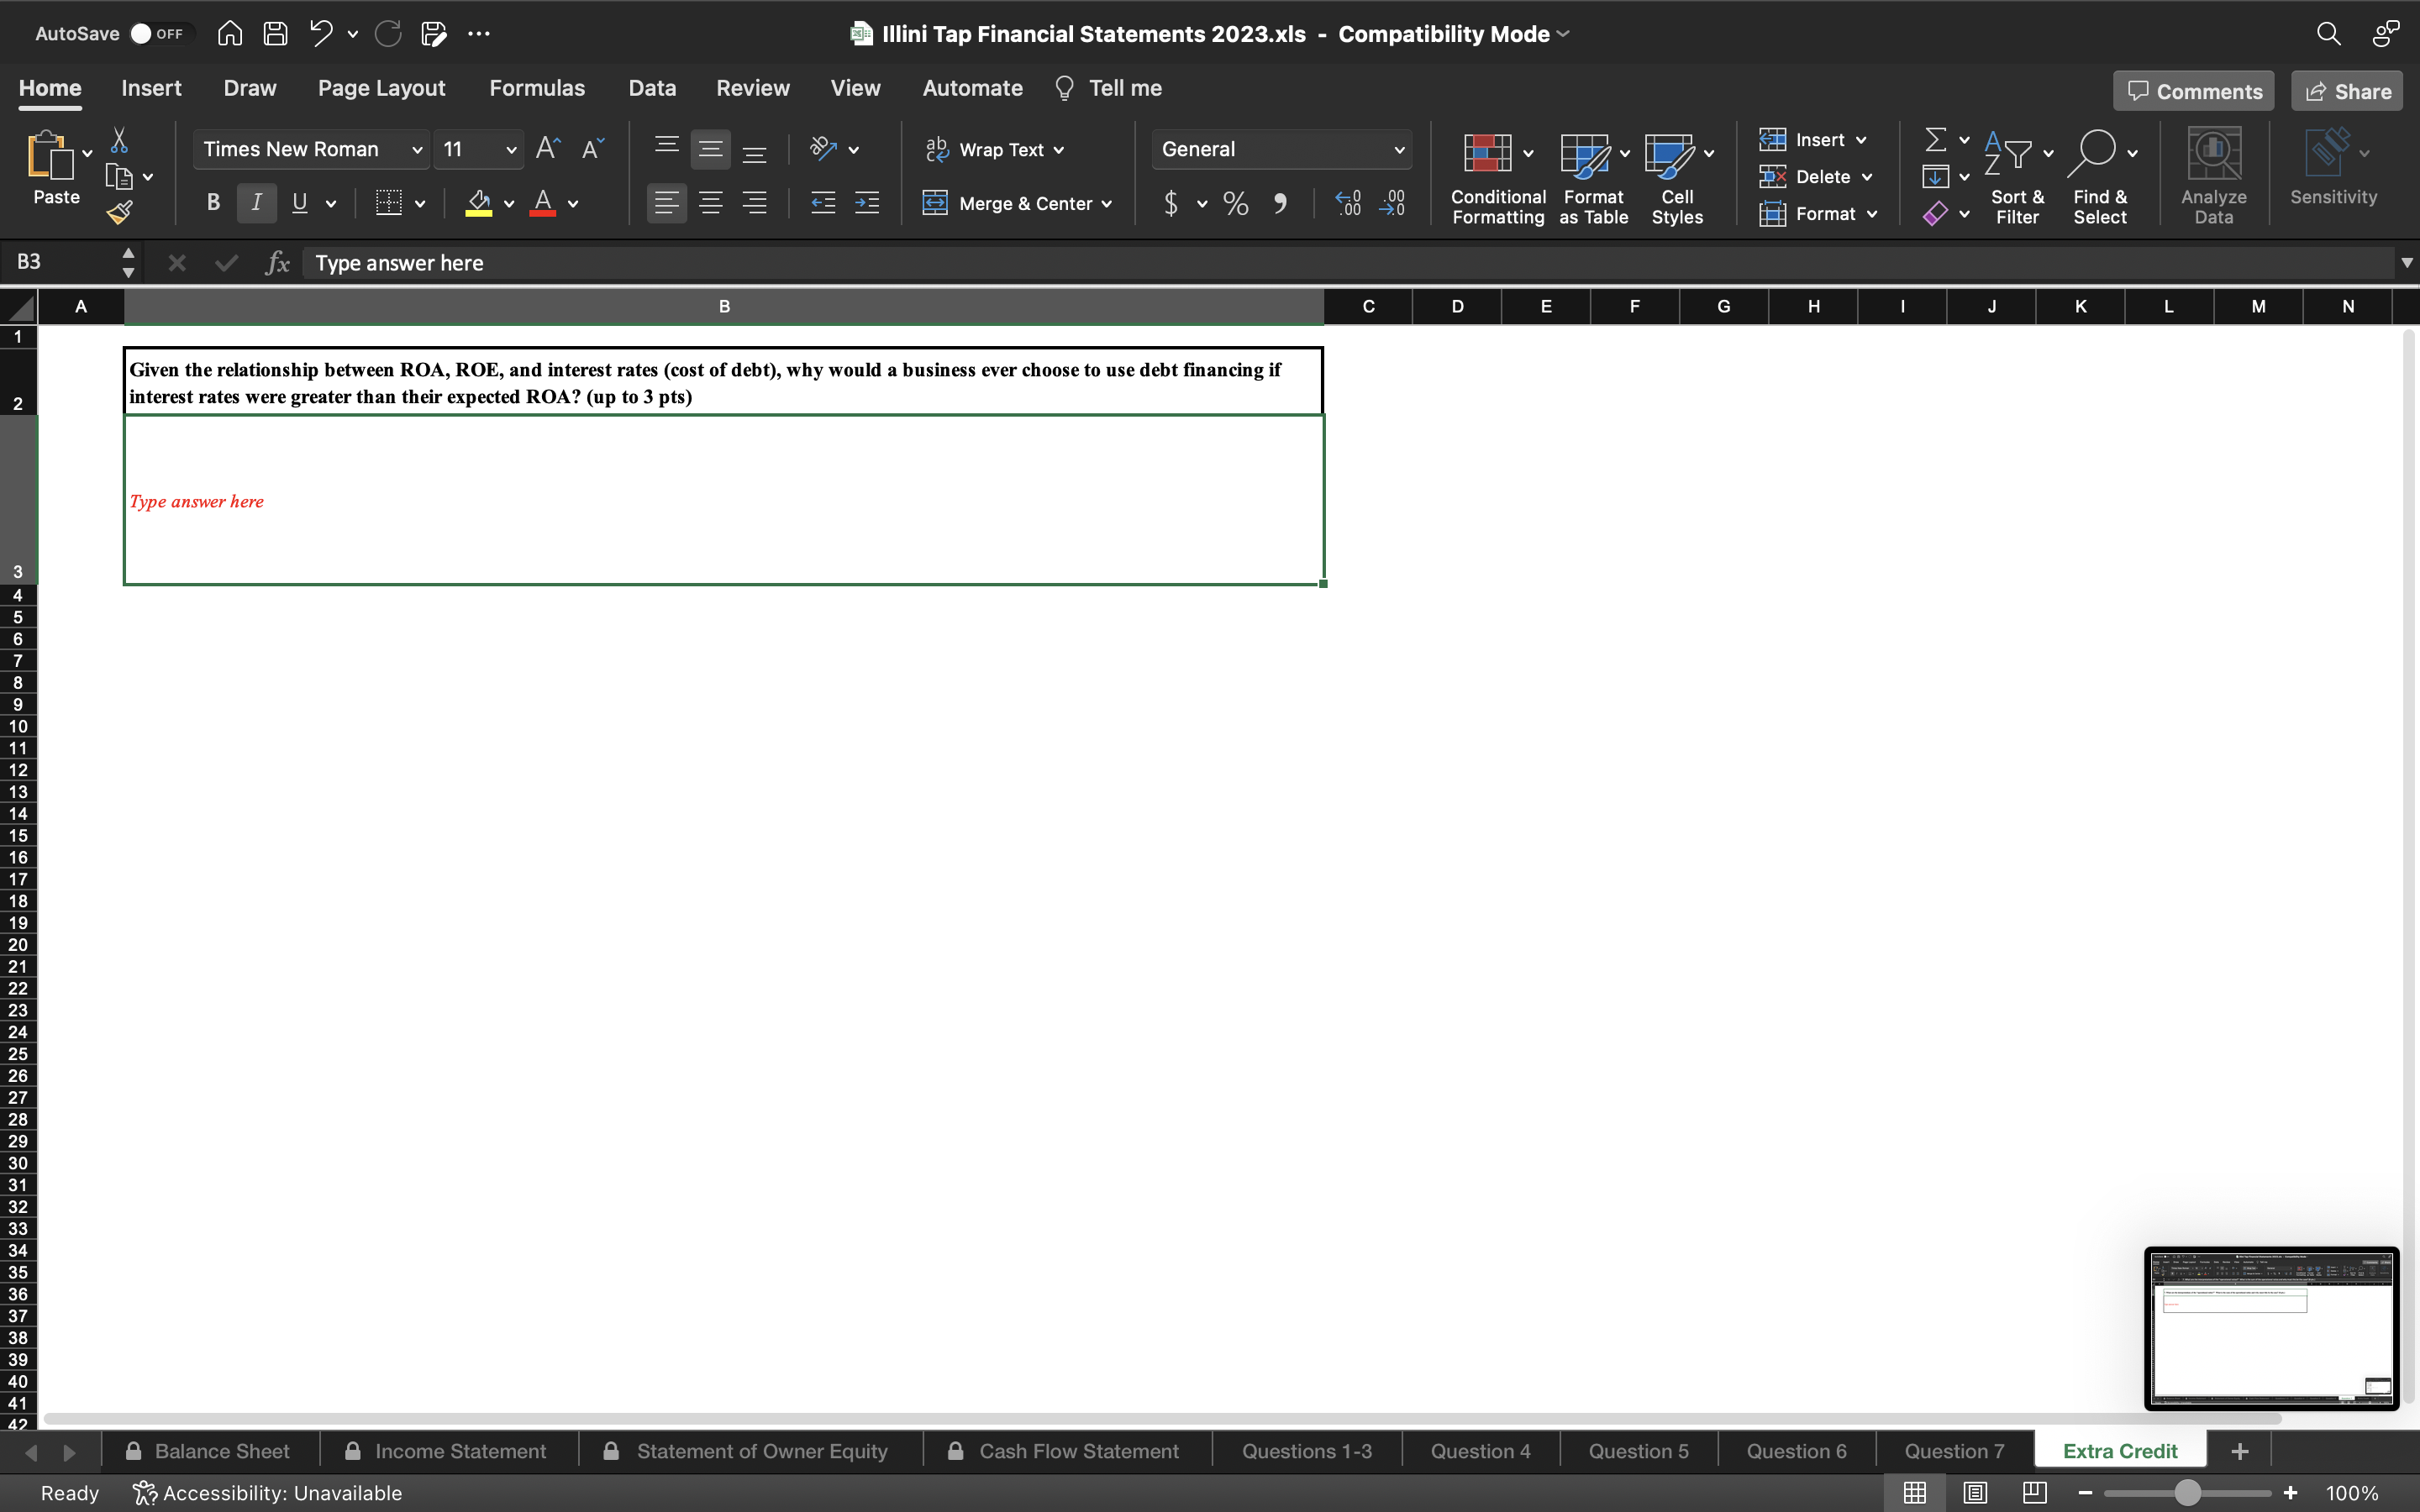
AutoSave ... w HW 4 2023 - Compatibility Mode - Saved to my Mac Home Insert Draw Design Layout References Mailings Review View Tell me Comments Editing Share Times New... 12 A A Aa v AL AaBbCcDdEe Aa BbCCD AaBbCcDdBe AaBbCcDdEe AaBbCcDdEe Paste ALVAv Emphasis Heading 1 Normal Strong Subtitle Styles Dictate Sensitivity Editor B I 1vab X2 Pane ACE 345 - Fall 2023 Homework #4 Due Friday September 29th, 2023 by 5 pm Complete the assignment using the "Illini Tap Financial Statements" excel file provided, and submit on Canvas by 5 pm Friday September 29th. For questions 1-4 you will need to refer to the 2022 system of financial statements for the Illini Tap included in the Excel file). Questions 5-7 do NOT use this information. 1. Complete the table below by calculating the missing performance measures for the Illini Tap. Calculate liquidity and solvency measures for 2021 and 2022 year ends. Note: the profitability, efficiency, and repayment measures can be calculated only for 2022 operations (32 pts.) Performance Measures for the Illini Tap Welcome back! 2021 2022 Current Ratio Working Capital Working Capital Ratio Debt-to-Asset Ratio Debt-to Equity Ratio Equity-to-Asset Ratio Return on Assets n/a Return on Equity n/a Operating Profit Margin In/a Asset Turnover Ratio n/a Repayment Capacity n/a $131,633 Repayment Margin In/a $102,633 Coverage Ratio In/a 2.49 Is the Illini Tap liquid? Is the bar solvent? Has the liquidity or solvency position of the bar changed dramatically during 2022? Do any of the liquidity or solvency measures indicate potential trouble for the bar? Provide a brief discussion for your answers (12 pts.) "HW 4 2023.doc": 2,214 characters (an approximate value) Focus E E + 103%AutoSave ... w HW 4 2023 - Compatibility Mode - Saved to my Mac Home Insert Draw Design Layout References Mailings Review View Tell me Comments Editing Share Times New... 12 A A Aav AL AaBbCcDdEe Aa BbCCD AaBbCcDdBe AaBbCcDdEe AaBbCcDdEe Paste B I 1vab X2 ALVAv Emphasis leading 1 Normal Strong Subtitle Styles Dictate Sensitivity Editor Pane 3. What does the repayment capacity represent? What does the repayment margin represent? Interpret the term debt and capital lease coverage ratio for the Illini Tap. (12 pts.) 4. Using the table below, briefly perform a DuPont Analysis comparing the ROA and ROE of the Illini Tap to the average for bars in Illinois. Does the Illini Tap use its assets more or less efficiently than the average IL bar? Does the Illini Tap generate more or less profit per dollar of revenue than the average IL bar? How does the Illini Tap's use of debt financing compare to the average bar in IL? (12 pts.) Company/Industry OPM ATR ROA LM ROE Illini Tap Average for IL Bars 20% 0.70 14% 1.67 20% Extra Credit: What is the Illini Tap's Interest/Avg. Asset ratio? Is that higher or lower than the average IL bar? (2 pts.) Why is the ROE greater than the ROA if the cost of debt is less than the ROA? Why is the ROE less than the ROA if the cost of debt is greater than the ROA? Why does the ROE equal the ROA if the cost of debt is equal to the ROA? (12 pts.) 6. Use the information below to calculate the ROE for Vandelay Industries using the following interest rates (cost of debt). SHOW YOUR WORK. (3 pts. each) a. 6% Vandelay Industries Information b. 8% Total Assets: 1,000,000 C. Debt-to-Equity Ratio (D/E): 1.5 d. 12% ROA: 10% 7. What are the interpretations of the "operational ratios?" What is the sum of the operational ratios and why must this be the case? (8 pts.) (More) Extra credit: Given the relationship between ROA, ROE, and interest rates (the cost of debt), why would a business ever choose to use debt financing if interest rates were greater than their expected ROA? (up to 3 points) Page 2 of 2 473 words English (United States) Accessibility: Unavailable Focus E 103%AutoSave OFF AH ? CE ... Illini Tap Financial Statements 2023.xls - Compatibility Mode Home Insert Draw Page Layout Formulas Data Review View Automate ? Tell me Comments L Share Arial 12 AA ab Wrap Text v Number Insert v 2 Ex Delete I v Paste BIUv A Merge & Center v v % " 508 Conditional Format Cell Sort & Find & Analyze Sensitivity Formatting as Table Styles Format Filter Select Data C4 X v fx B C D E N P Q R S U V W AA AB 1. Complete the table below by calculating the missing performance measures for the Illini Tap. Calculate liquidity and solvency measures for 2018 and 2019. Note: the profitability, efficiency, and repayments measures can be calculated only for 2019 operations (32 pts.) 202 2022 Current Ratio Working Capita Working Capital Ratio |Debt-to-Asset Ratio Debt-to Equity Ratio Equity-to-Asset Ratio Return on Assets n/a Return on Equity n/a Operating Profit Margin n/a Asset Turnover Ratio n/ Repayment Capacity $131,633 Repayment Margin n/a $102,633 Coverage Ratio n/a 2.49 2. Is the Illini Tap liquid? Is the bar solvent? Has the liquidity or solvency position of the bar changed dramatically during 2022? Do any of the liquidity or solvency 23 measures indicate potential trouble for the bar? Provide a brief discussion for your answers (12 pts.) Type answer here 24 25 3. What does the repayment capacity represent? What does the repayment margin represent? Interpret the term debt and capital lease coverage ratio for the Illini Tap. 26 (12 pts.) Type answer here 27 Balance Sheet A Income Statement Statement of Owner Equity Cash Flow Statement Questions 1-3 Question 4 Question 5 Question 6 Question 7 Extra Credit + Ready ? Accessibility: Unavailable 91%AutoSave OFF A ? CE ... Illini Tap Financial Statements 2023.xls - Compatibility Mode Home Insert Draw Page Layout Formulas Data Review View Automate ? Tell me Comments L Share Times New Roman 12 AA ab Wrap Text v Percentage Insert v Ex Delete Paste BI UV A Merge & Center v $ Conditional Format Cell Sort & Find & Analyze Sensitivity Formatting as Table Styles Format Q v Filter Select Data C21 X V fx answer here D K M N O P Q R S W N - Using the table below, briefly perform a DuPont Analysis comparing the ROA and ROE of the Illini Tap to the average for bars in Illinois. (12 pts total) Company/Industry OPM ATR ROA LM ROE Note: The values for OPM, ATR, ROA, and ROE were Illini Tap answer here answer here answer here answer here answer here calculated from the financial statements for question 1. 6 For the LM, use average assets and average equity to calculate. Average for IL Bars 20% 0.70 14% 1.67 20% 10 Does the Illini Tap use its assets more or less efficiently than the average IL bar? (2 pts) Type answer here 12 13 Does the Illini Tap generate more or less profit per dollar of revenue than the average IL bar? (2 pts) Type answer here 15 How does the Illini Tap's use of debt financing compare to the average bar in IL? (2 pts 16 Type answer here Extra Credit - Interest/Asset ratios 20 Illini Tap answer here Average IL Bar answer here Balance Sheet Income Statement Statement of Owner Equity Cash Flow Statement Questions 1-3 Question 4 Question 5 Question 6 Question 7 Extra Credit + Ready ?Accessibility: Unavailable 92%AutoSave OFF AH ? CE ... Illini Tap Financial Statements 2023.xls - Compatibility Mode Home Insert Draw Page Layout Formulas Data Review View Automate ? Tell me Comments L Share Times New Roman 12 AA aD Wrap Text v General Insert v x Delete Paste BI UV Merge & Center v $ ~ % " Conditional Format Cell Sort & Find & Analyze Sensitivity ormatting as Table Styles Format Filter Select Data B3 fx Type answer here A B C D E F G H 5. Why is the ROE greater than the ROA if the cost of debt is less than the ROA? Why is the ROE less than the ROA if the cost of debt is greater than the ROA? Why does the ROE equal the ROA if the cost of debt is equal to the ROA? (12 pts.) Type answer here 42 Balance Sheet Income Statement Statement of Owner Equity Cash Flow Statement Questions 1-3 Question 4 Question 5 Question 6 Question 7 Extra Credit + Ready Accessibility: Unavailable + 100%AutoSave OFF A ? CE ... Illini Tap Financial Statements 2023.xls - Compatibility Mode Home Insert Draw Page Layout Formulas Data Review View Automate ? Tell me Comments L Share Times New Roman 12 AA ab Wrap Text v General Insert v x Delete I v Paste B A Merge & Center v v % " 508 Conditional Format Cell Sort & Find & Analyze Sensitivity Formatting as Table Styles Format Filter Select Data F16 X V fx answer here B C D N P Q R S U W AA AB AC AD AE AF 6. Use the information below to calculate the ROE for Vandelay Industries at different interest rates (cost of debt). SHOW YOUR WORK. (3 pts. each) W N Total Assets $1,000,000 Debt-to-Equity Ratio (D/E) 1.5 eturn on Assets (ROA) 10.0% a r= 6.0% ROE = answer here b r= 8.0% ROE = answer here C r= 10.0% ROE = answer here d r= 12.0% ROE = answer here Hints 1. Use the DuPont formula for ROE 2. You will need to find the leverage multiplier (A/E). This value is the same for parts a through d. 3. You will need to calculate interest expenses to get the interest/asset ratio. Note that interest expenses will differ for each part since the interest rate changes. Space to show work Leverage Multiplier (LM) Interest Expense ($) nterest Expense/ Asset Ratio 8 8 898 8 Balance Sheet Income Statement Statement of Owner Equity Cash Flow Statement Questions 1-3 Question 4 Question 5 Question 6 Question 7 Extra Credit + Ready ? Accessibility: Unavailable Count: 4 81%AutoSave OFF AH . CE ... Illini Tap Financial Statements 2023.xls - Compatibility Mode Home Insert Draw Page Layout Formulas Data Review View Automate ? Tell me Comments L Share Times New Roman 12 A A aD Wrap Text v General Insert v Ex Delete Paste BI UV V A Merge & Center v v % 9 Conditional Format Cell Sort & Find & Analyze Sensitivity Formatting as Table Styles Format DV Filter Select Data B3 X V fx 7. What are the interpretations of the "operational ratios?" What is the sum of the operational ratios and why must this be the case? (8 pts.) A D E F G H 7. What are the interpretations of the "operational ratios?" What is the sum of the operational ratios and why must this be the case? (8 pts.) Type answer here Balance Sheet Income Statement Statement of Owner Equity Cash Flow Statement Questions 1-3 Question 4 Question 5 Question 6 Question 7 Extra Credit + Ready Accessibility: Unavailable - + 100%AutoSave OFF AH . CE ... Illini Tap Financial Statements 2023.xls - Compatibility Mode Home Insert Draw Page Layout Formulas Data Review View Automate ? Tell me Comments Share Times New Roman AA ab Wrap Text v General Insert v x Delete Paste BI UV Merge & Center v $ ~ % " Conditional Format Cell Sort & Find & Analyze Sensitivity Formatting as Table Styles Format DV Filter Select Data B3 fx Type answer here B C D E F G H M N Given the relationship between ROA, ROE, and interest rates (cost of debt), why would a business ever choose to use debt financing if 2 interest rates were greater than their expected ROA? (up to 3 pts) Type answer here 12 Balance Sheet Income Statement Statement of Owner Equity Cash Flow Statement Questions 1-3 Question 4 Question 5 Question 6 Question 7 Extra Credit + Ready Accessibility: Unavailable + 100%
Step by Step Solution
There are 3 Steps involved in it
1 Expert Approved Answer
Step: 1 Unlock
Question Has Been Solved by an Expert!
Get step-by-step solutions from verified subject matter experts
Step: 2 Unlock
Step: 3 Unlock
Students Have Also Explored These Related Finance Questions!