

Question: Average 0.75% 4.35% Historical Performance 0.83% 3.26% 1.16% 4.76% 1.02% 4.56% St. Dev. Rf = 0.01% Intercept Beta St. Dev. (e) 1 0.00533 0.38919 2.79%
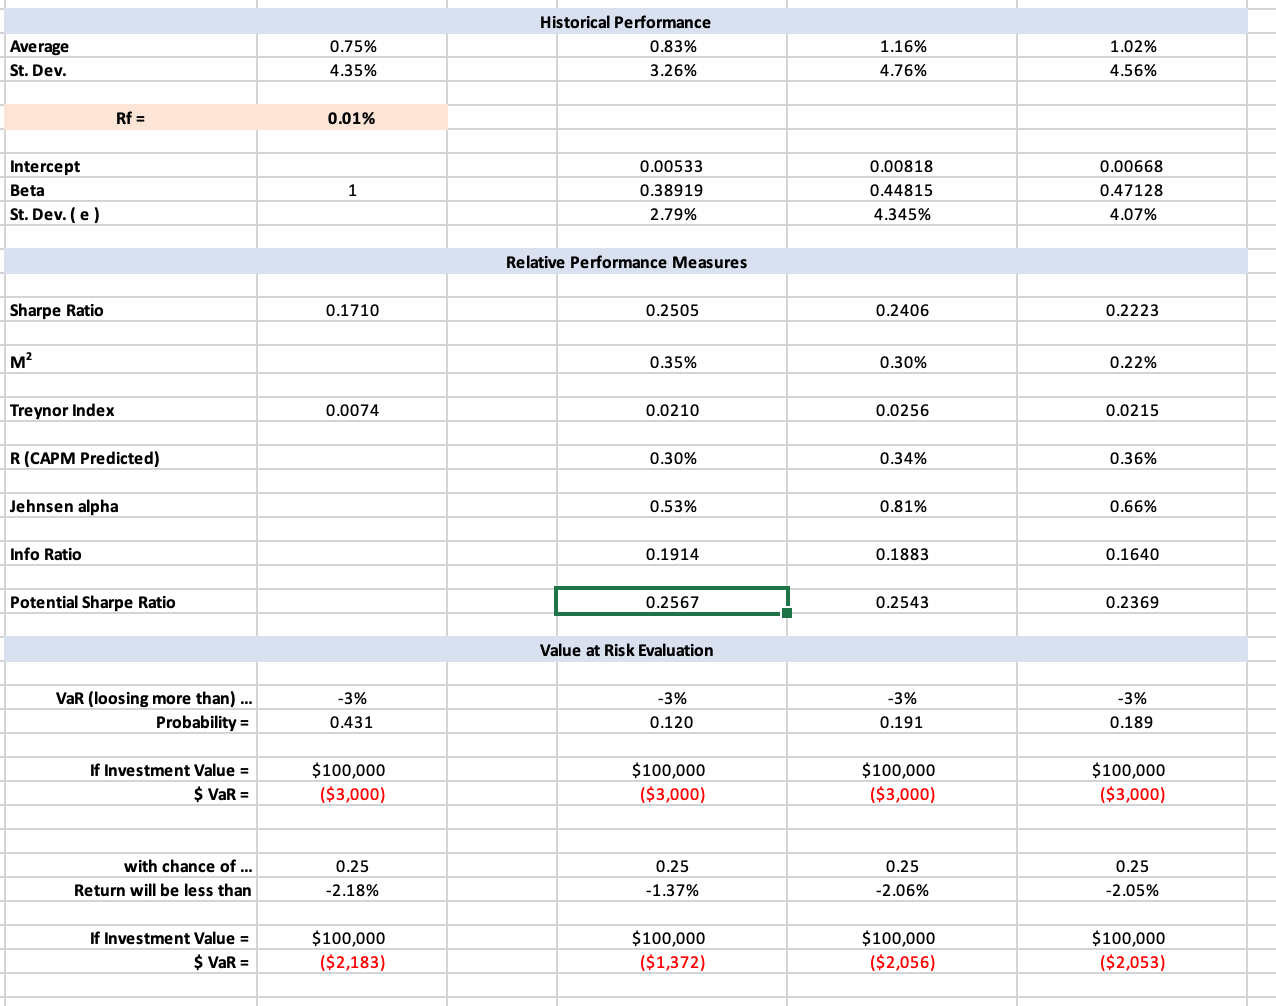
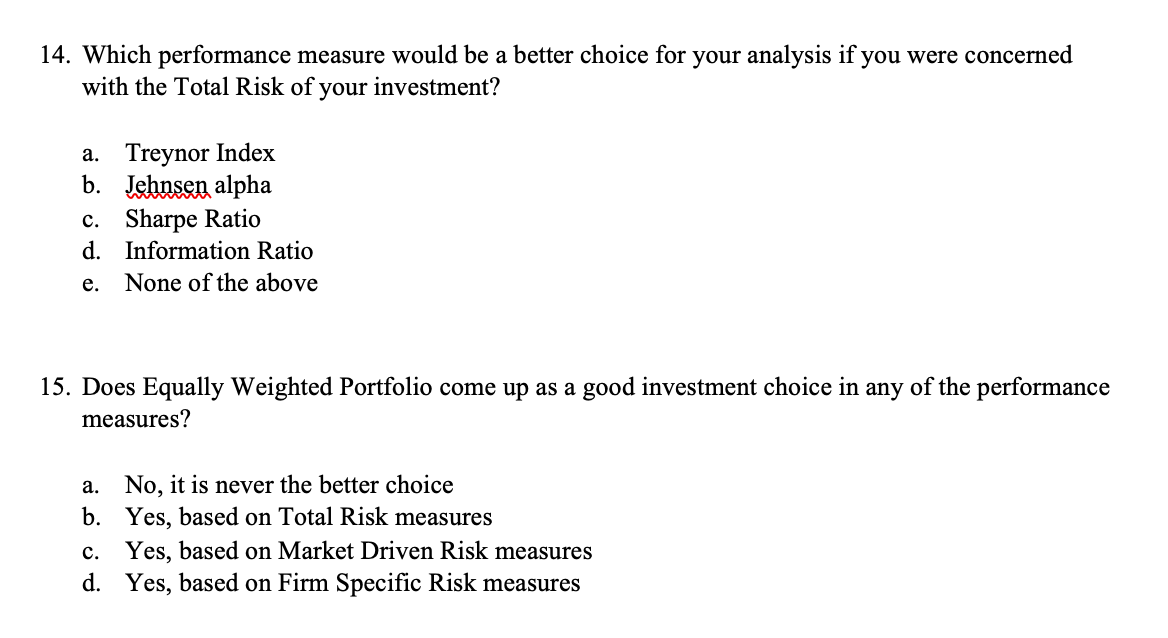
Average 0.75% 4.35% Historical Performance 0.83% 3.26% 1.16% 4.76% 1.02% 4.56% St. Dev. Rf = 0.01% Intercept Beta St. Dev. (e) 1 0.00533 0.38919 2.79% 0.00818 0.44815 4.345% 0.00668 0.47128 4.07% Relative Performance Measures Sharpe Ratio 0.1710 0.2505 0.2406 0.2223 M 0.35% 0.30% 0.22% Treynor Index 0.0074 0.0210 0.0256 0.0215 R (CAPM Predicted) 0.30% 0.34% 0.36% Jehnsen alpha 0.53% 0.81% 0.66% Info Ratio 0.1914 0.1883 0.1640 Potential Sharpe Ratio 0.2567 0.2543 0.2369 Value at Risk Evaluation -3% -3% VaR (loosing more than) ... Probability = -3% 0.431 -3% 0.191 0.120 0.189 If Investment Value = $ VaR = $100,000 ($3,000) $100,000 ($3,000) $100,000 ($3,000) $100,000 ($3,000) with chance of ... Return will be less than 0.25 -2.18% 0.25 -1.37% 0.25 -2.06% 0.25 -2.05% If Investment Value = $ VaR = $100,000 ($2,183) $100,000 ($1,372) $100,000 ($2,056) $100,000 ($2,053) 14. Which performance measure would be a better choice for your analysis if you were concerned with the Total Risk of your investment? a. Treynor Index b. Jehnsen alpha c. Sharpe Ratio d. Information Ratio e. None of the above 15. Does Equally Weighted Portfolio come up as a good investment choice in any of the performance measures? a. No, it is never the better choice b. Yes, based on Total Risk measures c. Yes, based on Market Driven Risk measures d. Yes, based on Firm Specific Risk measures
Step by Step Solution
There are 3 Steps involved in it

Get step-by-step solutions from verified subject matter experts