

Question: Average Annual Returns for U.S. Small Stocks, Large Stocks (S&P 500), Corporate Bonds, and Treasury Bills, 1926-2014 Investment Small stocks S&P 500 Corporate bonds Treasury
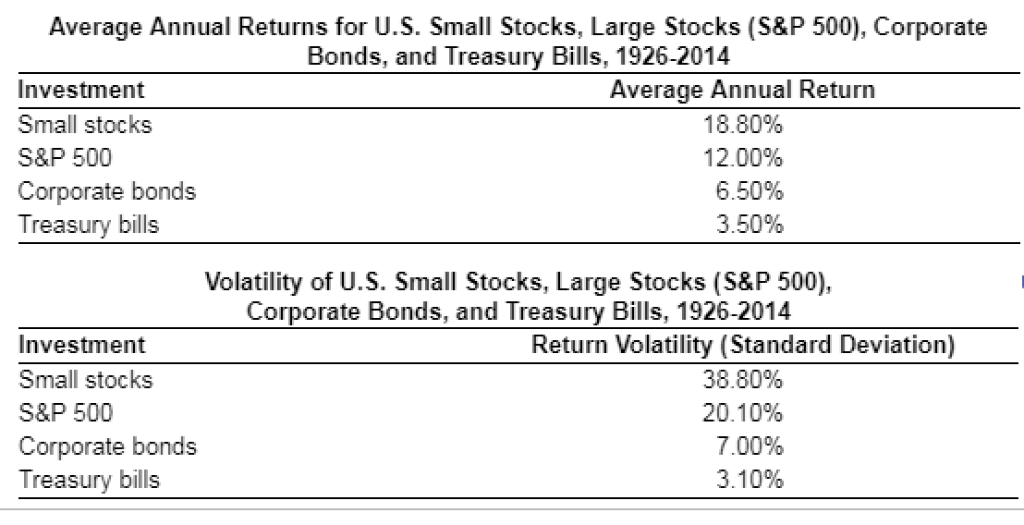
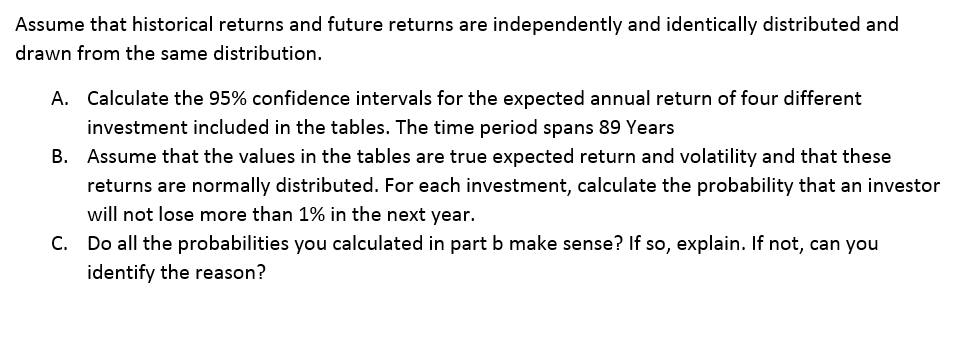
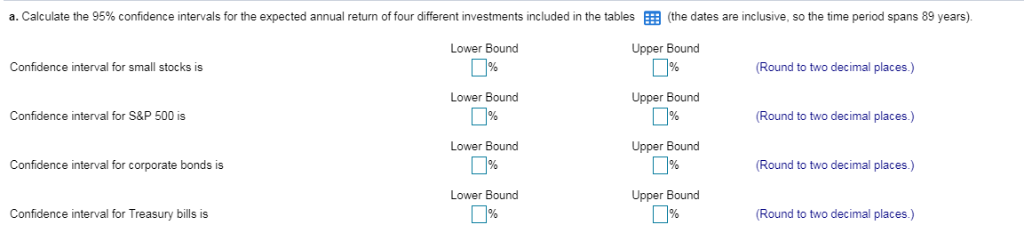
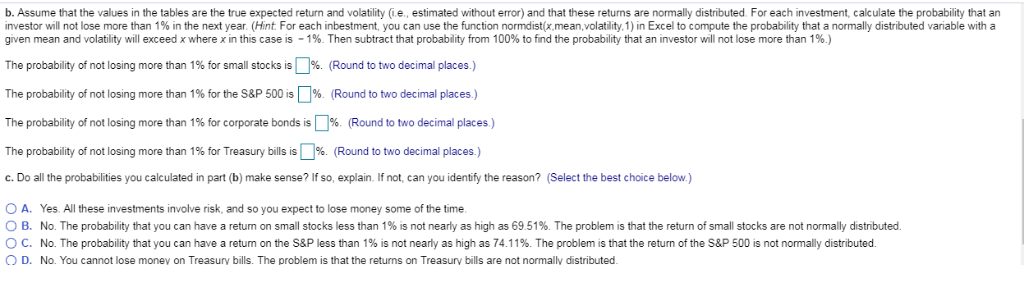
Average Annual Returns for U.S. Small Stocks, Large Stocks (S&P 500), Corporate Bonds, and Treasury Bills, 1926-2014 Investment Small stocks S&P 500 Corporate bonds Treasury bills Average Annual Return 18.80% 12 .00% 6.50% 3.50% Volatility of U.S. Small Stocks, Large Stocks (S&P 500), Corporate Bonds, and Treasury Bills, 1926-2014 Investment Small stocks S&P 500 Corporate bonds Treasury bills Return Volatility (Standard Deviation) 38.80% 20.10% 7.00% 3.10% Assume that historical returns and future returns are independently and identically distributed and drawn from the same distribution Calculate the 95% confidence intervals for the expected annual return of four different investment included in the tables. The time period spans 89 Years Assume that the values in the tables are true expected return and volatility and that these returns are normally distributed. For each investment, calculate the probability that an investor will not lose more than 1% in the next year. Do all the probabilities you calculated in part b make sense? If so, explain. If not, can you identify the reason A. B. C. a. Calculate the 95% confidence intervals for the expected annual return of four different mestments included in the tables the dates are inclusive, so the time penod spans 89 years Lower Bound Upper Bound Confidence interval for small stocks is (Round to two decimal places.) Lower Bound Upper Bound Confidence interval for S&P 500 is Round to two decimal places.) Lower Bound Upper Bound Confidence interval for corporate bonds is Round to two decimal places.) Lower Bound Upper Bound Confidence interval for Treasury bills is Round to two decimal places.) b. Assume that the values in the tables are the true expected return and volatility (i.e, estimated without error) and that these returns are normally distributed. For each investment, calculate the probability that an investor will not lose more than 1% in the next year. (Hint For each inbestment, you can use the function normdist(x.mean,volatility, 1) in Excel to compute the probability that a normally distributed variable with a given mean and volatility will exceed x where x n this case is-196. Then subtract that probability from 100% to find the probability that an investor will not lose more than 1% The probability of not losing more than 1% for small stocks is 96 Round to two decimal places The probability of not losing more than 1% for the S&P 500 is L1% (Round to two decimal places ) The probability of not losing more than 1% for corporate bonds is | % (Round to two decimal places ) The probability of not losing more than 1% for Treasury bills Round to two decimal places ) .Do all the probabilities you calculated in part (b) make sense? If so, explain. If not, can you identify the reason? (Select the best choice below.) O A. Yes. ll these investments involve risk, and so you expect to lose money some of the time. O B. No. The probability that you can have a returm on small stocks less than 1% is not nearly as high as 69.51%. The problem is that the return of small stocks are not normally distributed O c. No. The probability that you can have a return on the S&P less than 1% 1s not nearly as high as 74.11%. The problem is that the return of the S&P 500 is not normally distributed. D. No. You cannot lose monev on Treasury bills The problem is that the returns on Treasury bills are not nor mally distributed. Average Annual Returns for U.S. Small Stocks, Large Stocks (S&P 500), Corporate Bonds, and Treasury Bills, 1926-2014 Investment Small stocks S&P 500 Corporate bonds Treasury bills Average Annual Return 18.80% 12 .00% 6.50% 3.50% Volatility of U.S. Small Stocks, Large Stocks (S&P 500), Corporate Bonds, and Treasury Bills, 1926-2014 Investment Small stocks S&P 500 Corporate bonds Treasury bills Return Volatility (Standard Deviation) 38.80% 20.10% 7.00% 3.10% Assume that historical returns and future returns are independently and identically distributed and drawn from the same distribution Calculate the 95% confidence intervals for the expected annual return of four different investment included in the tables. The time period spans 89 Years Assume that the values in the tables are true expected return and volatility and that these returns are normally distributed. For each investment, calculate the probability that an investor will not lose more than 1% in the next year. Do all the probabilities you calculated in part b make sense? If so, explain. If not, can you identify the reason A. B. C. a. Calculate the 95% confidence intervals for the expected annual return of four different mestments included in the tables the dates are inclusive, so the time penod spans 89 years Lower Bound Upper Bound Confidence interval for small stocks is (Round to two decimal places.) Lower Bound Upper Bound Confidence interval for S&P 500 is Round to two decimal places.) Lower Bound Upper Bound Confidence interval for corporate bonds is Round to two decimal places.) Lower Bound Upper Bound Confidence interval for Treasury bills is Round to two decimal places.) b. Assume that the values in the tables are the true expected return and volatility (i.e, estimated without error) and that these returns are normally distributed. For each investment, calculate the probability that an investor will not lose more than 1% in the next year. (Hint For each inbestment, you can use the function normdist(x.mean,volatility, 1) in Excel to compute the probability that a normally distributed variable with a given mean and volatility will exceed x where x n this case is-196. Then subtract that probability from 100% to find the probability that an investor will not lose more than 1% The probability of not losing more than 1% for small stocks is 96 Round to two decimal places The probability of not losing more than 1% for the S&P 500 is L1% (Round to two decimal places ) The probability of not losing more than 1% for corporate bonds is | % (Round to two decimal places ) The probability of not losing more than 1% for Treasury bills Round to two decimal places ) .Do all the probabilities you calculated in part (b) make sense? If so, explain. If not, can you identify the reason? (Select the best choice below.) O A. Yes. ll these investments involve risk, and so you expect to lose money some of the time. O B. No. The probability that you can have a returm on small stocks less than 1% is not nearly as high as 69.51%. The problem is that the return of small stocks are not normally distributed O c. No. The probability that you can have a return on the S&P less than 1% 1s not nearly as high as 74.11%. The problem is that the return of the S&P 500 is not normally distributed. D. No. You cannot lose monev on Treasury bills The problem is that the returns on Treasury bills are not nor mally distributed
Step by Step Solution
There are 3 Steps involved in it

Get step-by-step solutions from verified subject matter experts