

Question: Average Plant Headcount 1. Generate as many valid forecasts as you can for each of the smoothing constants. Assume a January forecast of 298 2.
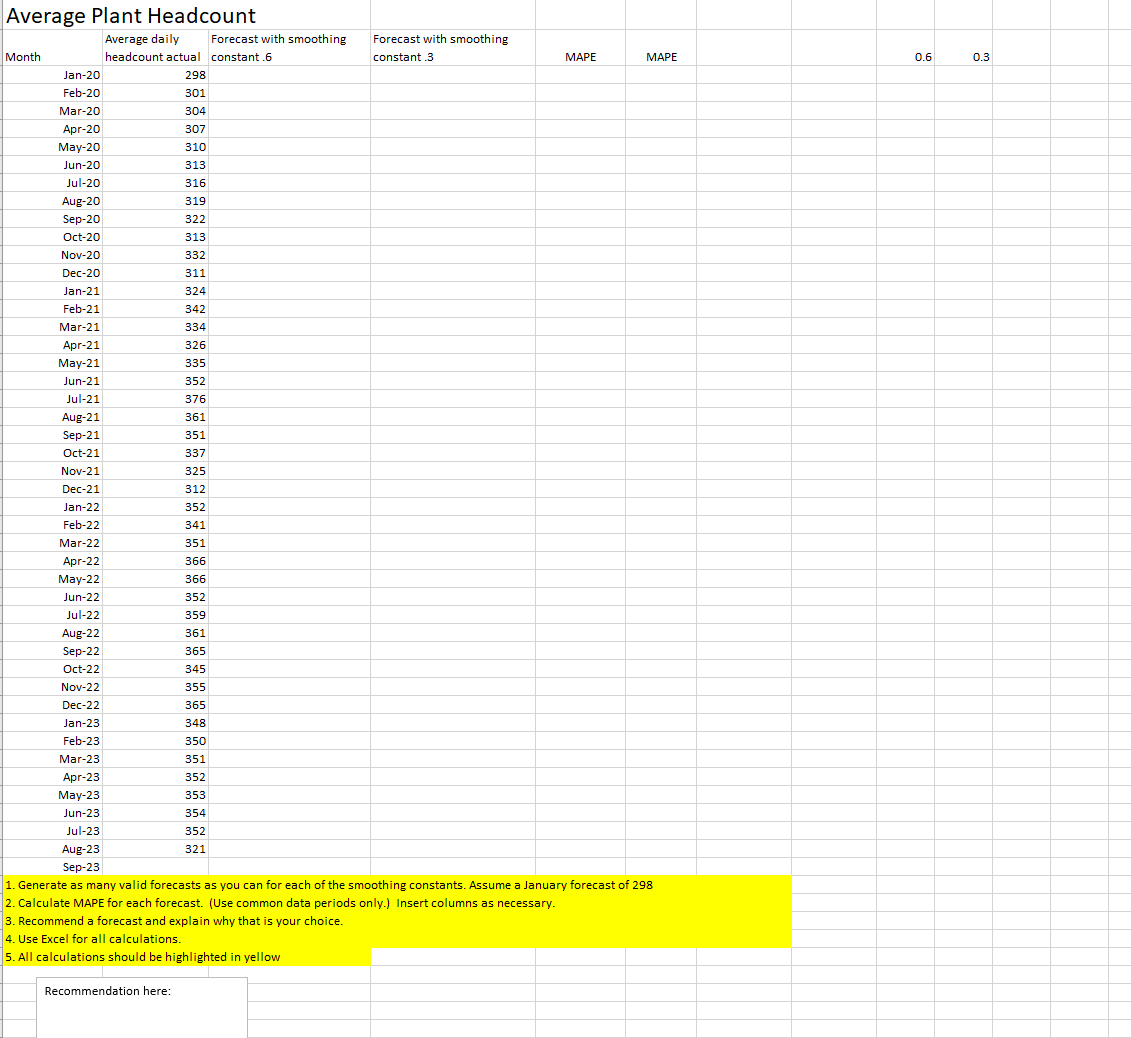
Average Plant Headcount 1. Generate as many valid forecasts as you can for each of the smoothing constants. Assume a January forecast of 298 2. Calculate MAPE for each forecast. (Use common data periods only.) Insert columns as necessary. 3. Recommend a forecast and explain why that is your choice. 4. Use Excel for all calculations. 5. All calculations should be highlighted in yellow Recommendation here: Average Plant Headcount 1. Generate as many valid forecasts as you can for each of the smoothing constants. Assume a January forecast of 298 2. Calculate MAPE for each forecast. (Use common data periods only.) Insert columns as necessary. 3. Recommend a forecast and explain why that is your choice. 4. Use Excel for all calculations. 5. All calculations should be highlighted in yellow Recommendation here
Step by Step Solution
There are 3 Steps involved in it

Get step-by-step solutions from verified subject matter experts