

Question: Average speed Position (m) 200 100 The graph above shows the position of a car, in meters, measured from a stoplight after the light turns
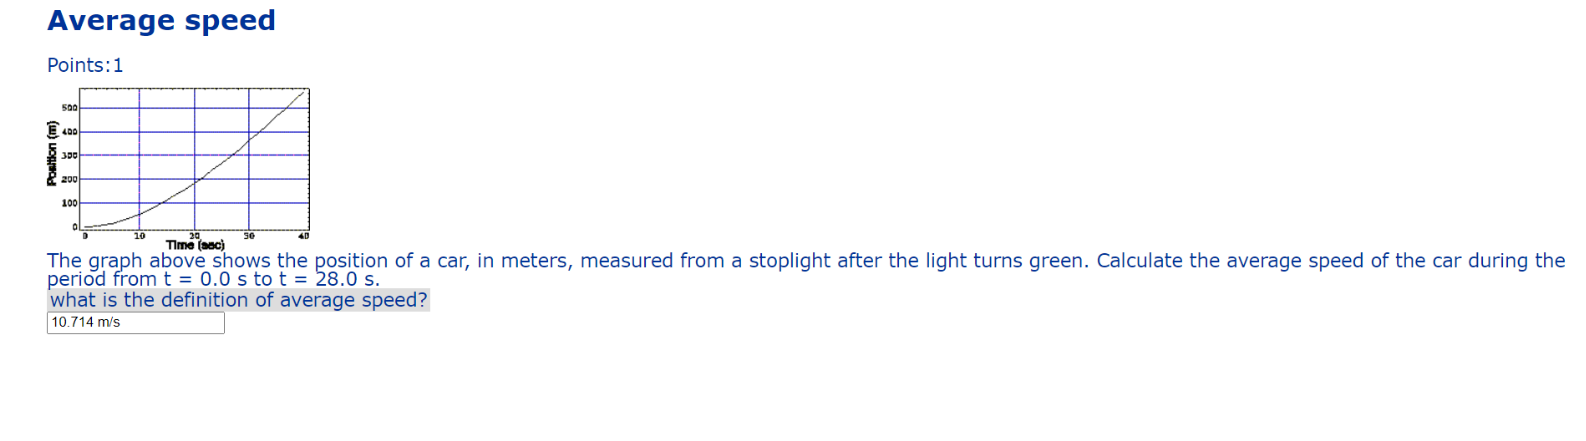
Average speed Position (m) 200 100 The graph above shows the position of a car, in meters, measured from a stoplight after the light turns green. Calculate the average speed of the car during the period from t = 0.0 s to t = 28.0 s. what is the definition of average speed? 10.714 m/'s
Step by Step Solution
There are 3 Steps involved in it
1 Expert Approved Answer
Step: 1 Unlock

Question Has Been Solved by an Expert!
Get step-by-step solutions from verified subject matter experts
Step: 2 Unlock
Step: 3 Unlock