

Question: Average Temperature (F) Part I. Research Methods Exercises 49 100 90 80 70 60 50 40 30 20 10 0 Jan Feb Mar Apr
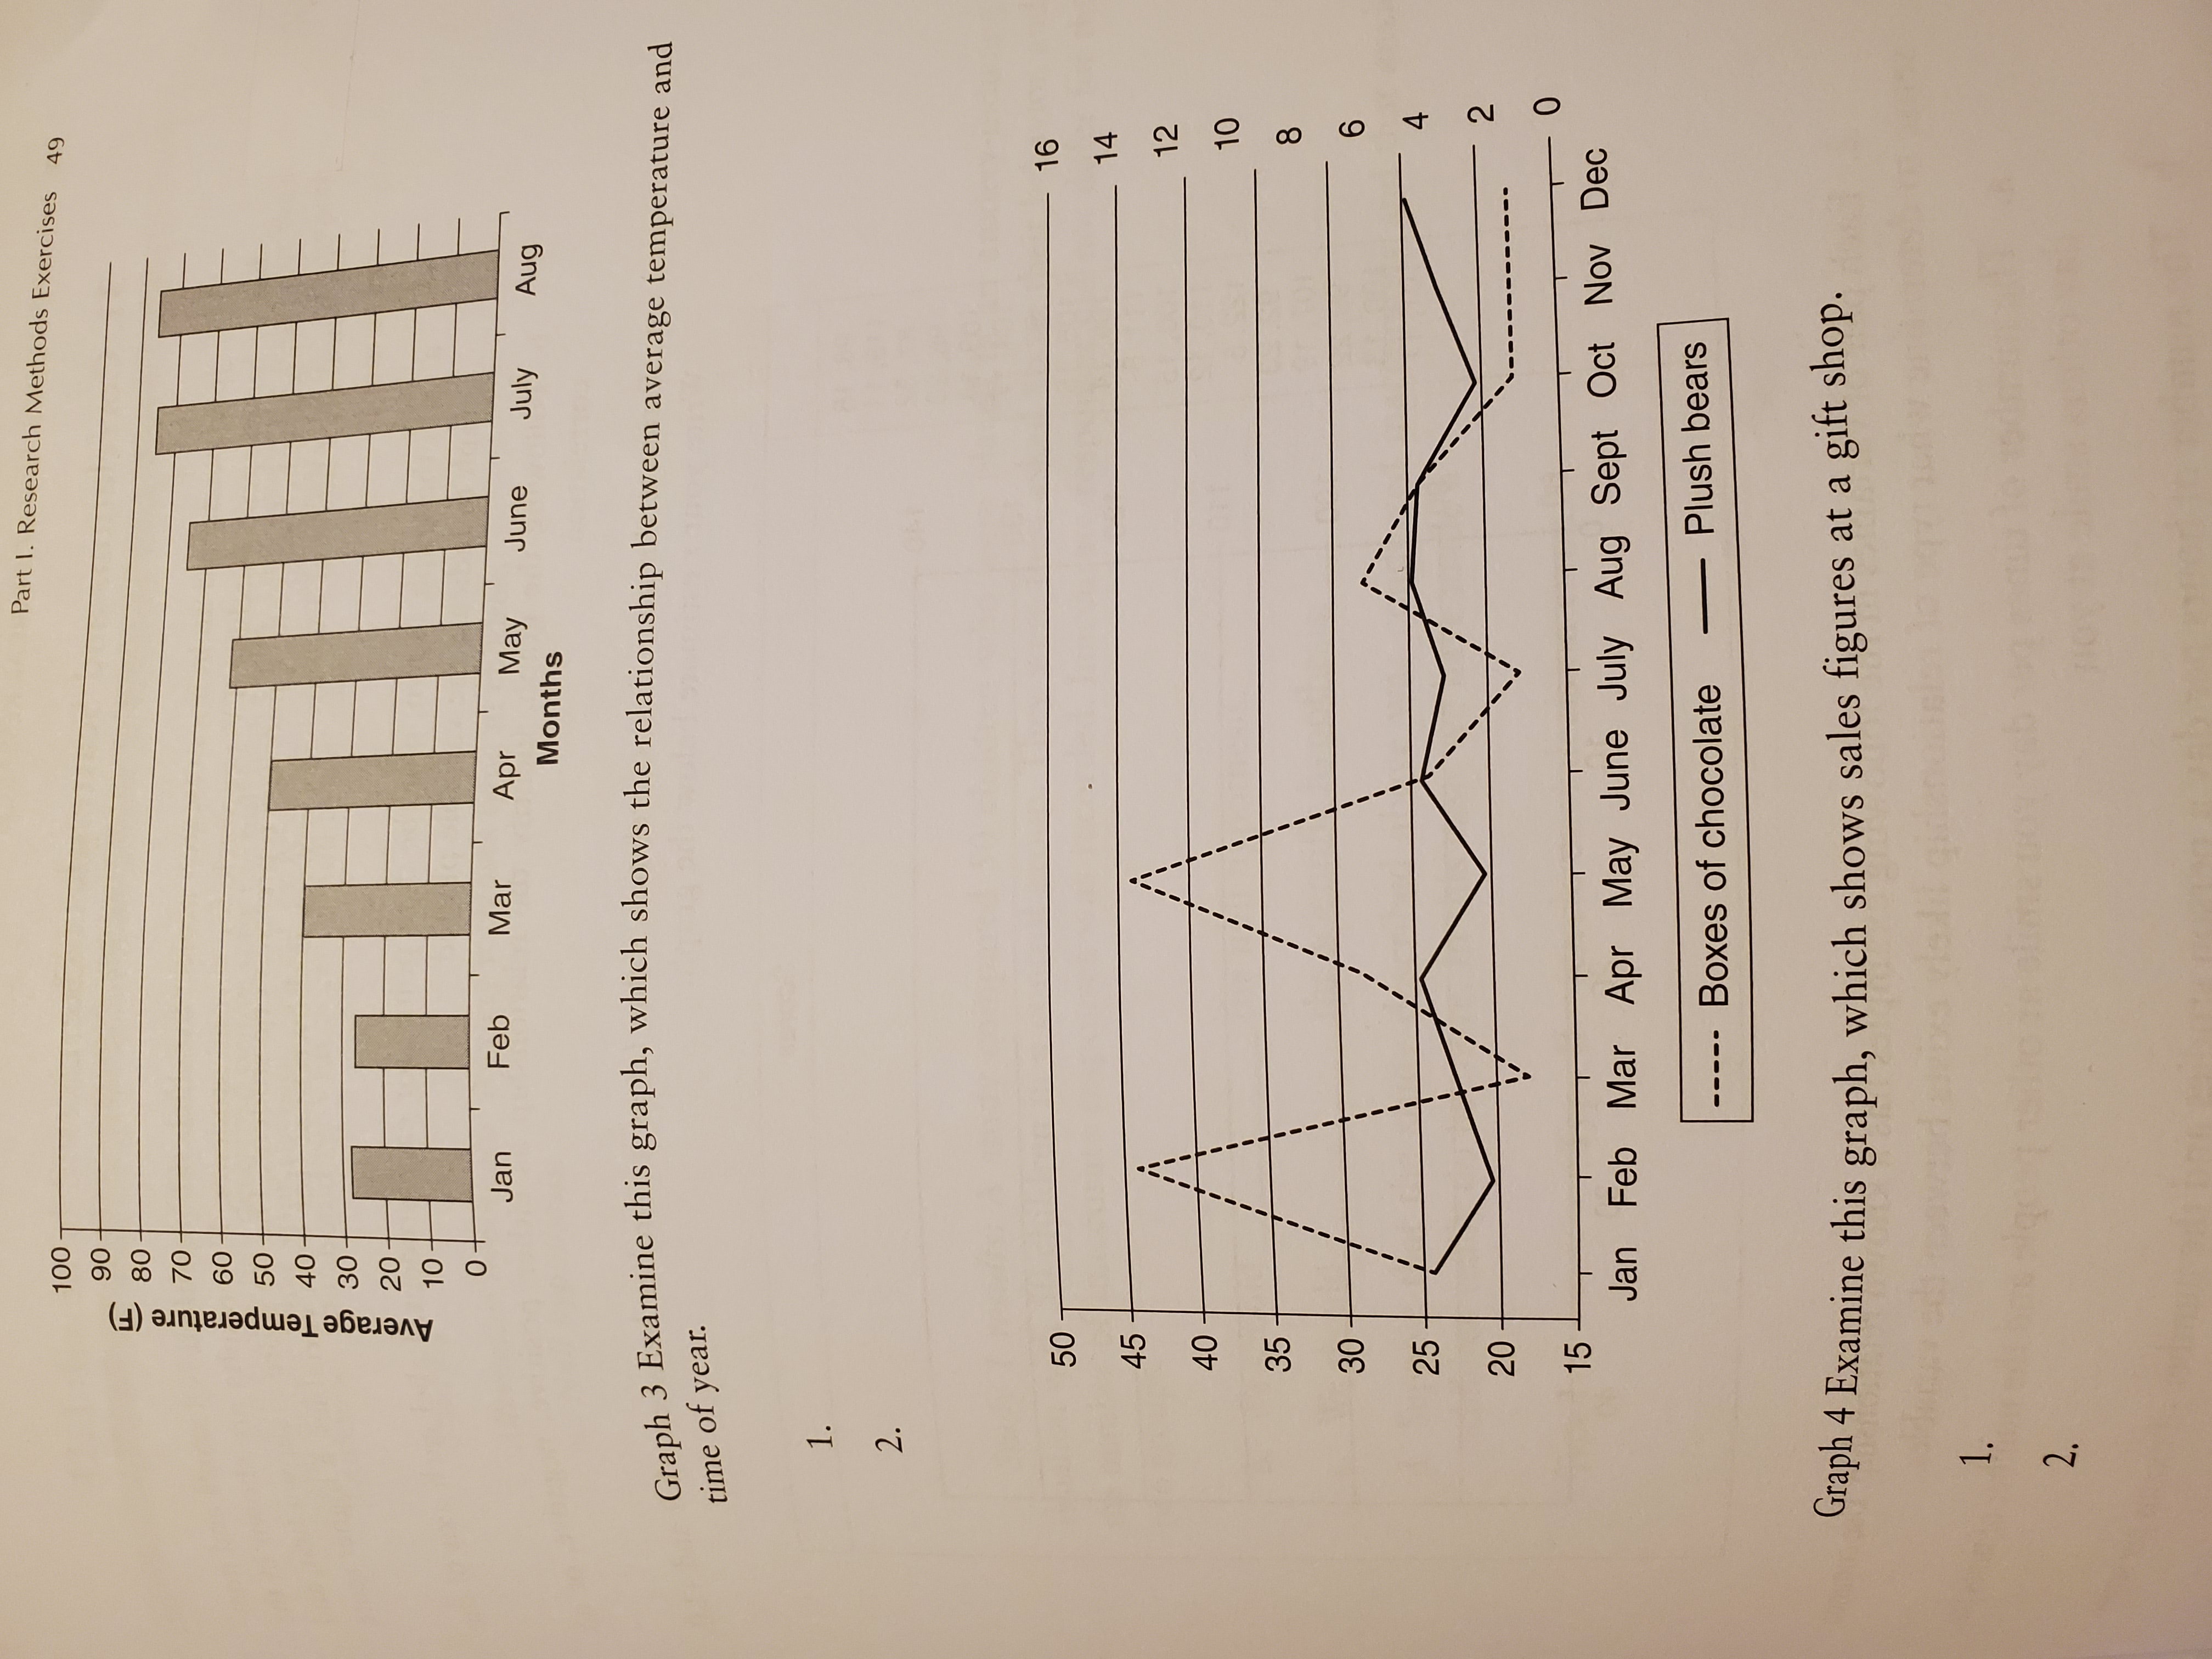
Average Temperature (F) Part I. Research Methods Exercises 49 100 90 80 70 60 50 40 30 20 10 0 Jan Feb Mar Apr May June July Aug Months Graph 3 Examine this graph, which shows the relationship between average temperature and time of year. 1. 2. 50 50 - 16 14 125 45 40 35 30 25 20 12 10 8 6 4 - 2 - 0 15- Jan Feb Mar Apr May June July Aug Sept Aug Sept Oct Nov Dec Boxes of chocolate Plush bears Graph 4 Examine this graph, which shows sales figures at a gift shop. 1. 2.
Step by Step Solution
There are 3 Steps involved in it
1 Expert Approved Answer
Step: 1 Unlock

Question Has Been Solved by an Expert!
Get step-by-step solutions from verified subject matter experts
Step: 2 Unlock
Step: 3 Unlock