

Question: a)What are the control limits for the mean chart? UCLx = ounces (round your response to two decimal places). LCLx = ounces (round your response
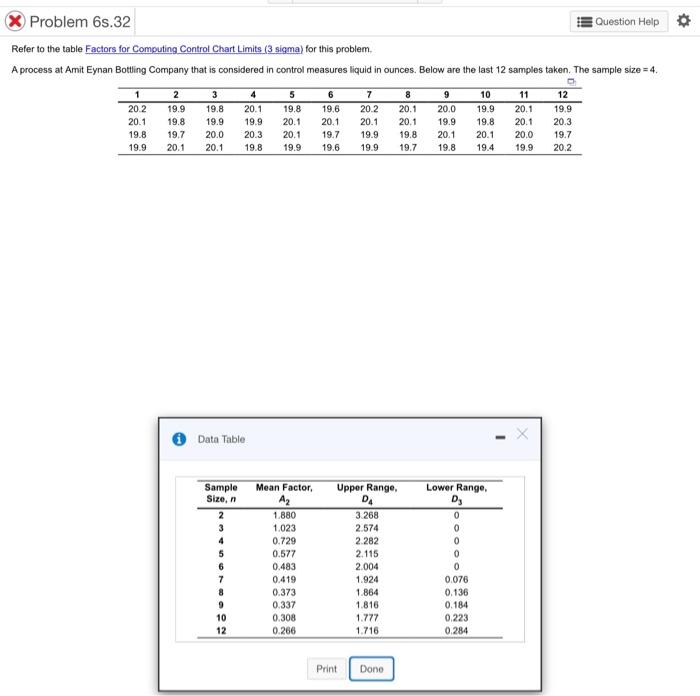
a)What are the control limits for the mean chart?
UCLx = ounces (round your response to two decimal places).
LCLx = ounces (round your response to two decimal places).
What is the graph of the sample data for the x-chart?
b) What are the control limits for the range chart?
UCLR = ounces (round your response to two decimal places).
LCLR = ounces (round your response to two decimal places).
What is graph of the sample data for the R-chart?
c) Is the process in control?
Step by Step Solution
There are 3 Steps involved in it
1 Expert Approved Answer
Step: 1 Unlock

Question Has Been Solved by an Expert!
Get step-by-step solutions from verified subject matter experts
Step: 2 Unlock
Step: 3 Unlock