

Question: B 3 2 0 w N - -6 E 1 The president of a drywall manufacturing company is analyzing the variables that 2 The president
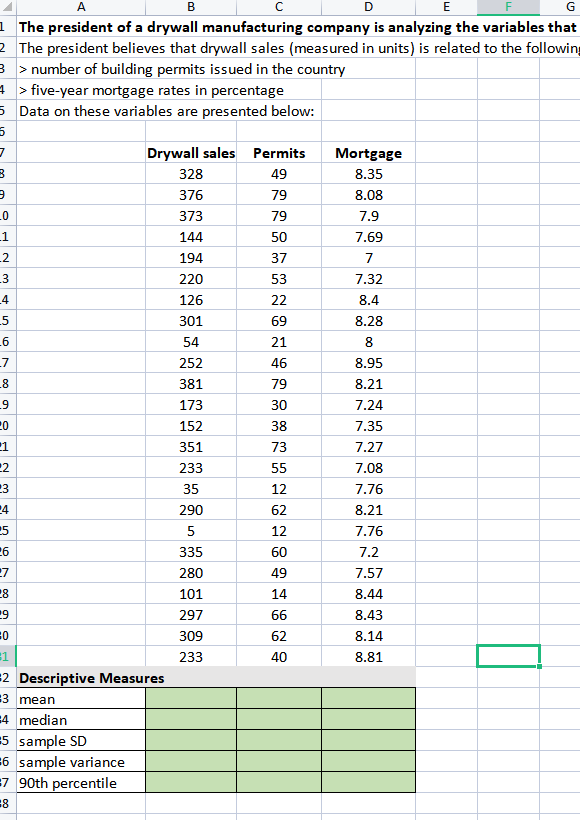
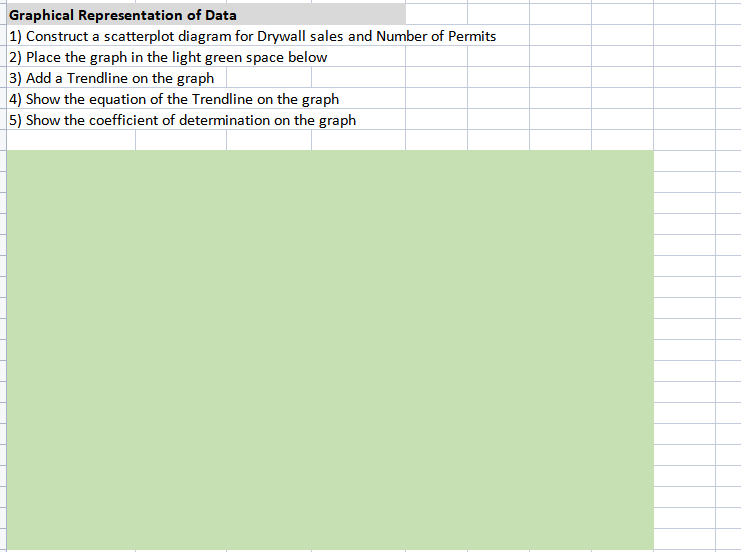
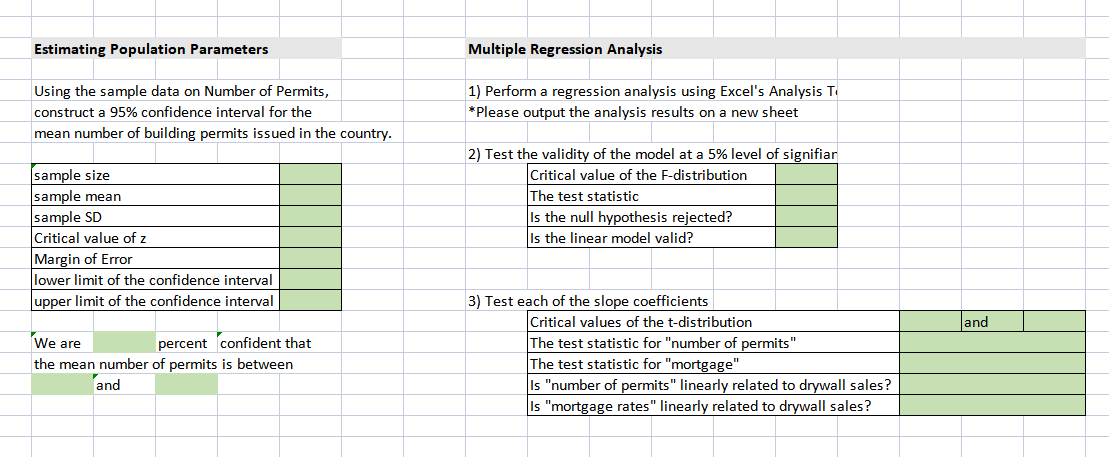
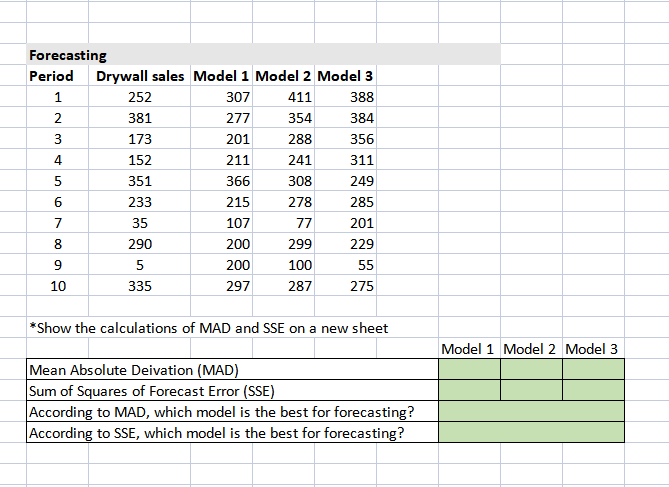
B 3 2 0 w N - -6 E 1 The president of a drywall manufacturing company is analyzing the variables that 2 The president believes that drywall sales (measured in units) is related to the following 3 > number of building permits issued in the country 4 > five-year mortgage rates in percentage 5 Data on these variables are presented below: 5 7 Drywall sales Permits Mortgage 328 49 8.35 376 79 8.08 373 79 7.9 1 144 50 7.69 . 194 37 7 220 53 7.32 4 126 22 8.4 -5 301 69 8.28 54 21 8 -7 252 46 8.95 -8 381 79 8.21 9 173 30 7.24 20 152 38 7.35 1 351 73 7.27 22 233 55 7.08 23 35 12 7.76 24 290 62 8.21 25 5 12 7.76 26 335 60 7.2 27 280 49 7.57 28 101 14 8.44 29 297 66 8.43 309 62 8.14 31 233 40 8.81 2 Descriptive Measures =3 mean -4 median 5 sample SD 6 sample variance =7 90th percentile 8 9 20 Graphical Representation of Data 1) Construct a scatterplot diagram for Drywall sales and Number of Permits 2) Place the graph in the light green space below 3) Add a Trendline on the graph 4) Show the equation of the Trendline on the graph 5) Show the coefficient of determination on the graph Estimating Population Parameters Multiple Regression Analysis Using the sample data on Number of Permits, construct a 95% confidence interval for the mean number of building permits issued in the country. 1) Perform a regression analysis using Excel's Analysis T *Please output the analysis results on a new sheet sample size sample mean sample SD Critical value of z Margin of Error lower limit of the confidence interval upper limit of the confidence interval 2) Test the validity of the model at a 5% level of signifiar Critical value of the F-distribution The test statistic Is the null hypothesis rejected? Is the linear model valid? and We are percent confident that the mean number of permits is between and 3) Test each of the slope coefficients Critical values of the t-distribution The test statistic for "number of permits" The test statistic for "mortgage" Is "number of permits" linearly related to drywall sales? Is "mortgage rates" linearly related to drywall sales? Nm Forecasting Period Drywall sales Model 1 Model 2 Model 3 1 252 307 411 388 2 381 277 354 384 3 173 201 288 356 4 152 211 241 311 5 351 366 308 249 6 233 215 278 285 7 35 107 77 201 290 200 299 229 9 5 200 100 55 10 335 297 287 275 00 *Show the calculations of MAD and SSE on a new sheet Model 1 Model 2 Model 3 Mean Absolute Deivation (MAD) Sum of Squares of Forecast Error (SSE) According to MAD, which model is the best for forecasting? According to SSE, which model is the best for forecasting? B 3 2 0 w N - -6 E 1 The president of a drywall manufacturing company is analyzing the variables that 2 The president believes that drywall sales (measured in units) is related to the following 3 > number of building permits issued in the country 4 > five-year mortgage rates in percentage 5 Data on these variables are presented below: 5 7 Drywall sales Permits Mortgage 328 49 8.35 376 79 8.08 373 79 7.9 1 144 50 7.69 . 194 37 7 220 53 7.32 4 126 22 8.4 -5 301 69 8.28 54 21 8 -7 252 46 8.95 -8 381 79 8.21 9 173 30 7.24 20 152 38 7.35 1 351 73 7.27 22 233 55 7.08 23 35 12 7.76 24 290 62 8.21 25 5 12 7.76 26 335 60 7.2 27 280 49 7.57 28 101 14 8.44 29 297 66 8.43 309 62 8.14 31 233 40 8.81 2 Descriptive Measures =3 mean -4 median 5 sample SD 6 sample variance =7 90th percentile 8 9 20 Graphical Representation of Data 1) Construct a scatterplot diagram for Drywall sales and Number of Permits 2) Place the graph in the light green space below 3) Add a Trendline on the graph 4) Show the equation of the Trendline on the graph 5) Show the coefficient of determination on the graph Estimating Population Parameters Multiple Regression Analysis Using the sample data on Number of Permits, construct a 95% confidence interval for the mean number of building permits issued in the country. 1) Perform a regression analysis using Excel's Analysis T *Please output the analysis results on a new sheet sample size sample mean sample SD Critical value of z Margin of Error lower limit of the confidence interval upper limit of the confidence interval 2) Test the validity of the model at a 5% level of signifiar Critical value of the F-distribution The test statistic Is the null hypothesis rejected? Is the linear model valid? and We are percent confident that the mean number of permits is between and 3) Test each of the slope coefficients Critical values of the t-distribution The test statistic for "number of permits" The test statistic for "mortgage" Is "number of permits" linearly related to drywall sales? Is "mortgage rates" linearly related to drywall sales? Nm Forecasting Period Drywall sales Model 1 Model 2 Model 3 1 252 307 411 388 2 381 277 354 384 3 173 201 288 356 4 152 211 241 311 5 351 366 308 249 6 233 215 278 285 7 35 107 77 201 290 200 299 229 9 5 200 100 55 10 335 297 287 275 00 *Show the calculations of MAD and SSE on a new sheet Model 1 Model 2 Model 3 Mean Absolute Deivation (MAD) Sum of Squares of Forecast Error (SSE) According to MAD, which model is the best for forecasting? According to SSE, which model is the best for forecasting
Step by Step Solution
There are 3 Steps involved in it

Get step-by-step solutions from verified subject matter experts