

Question: (b) A financial analyst was tasked to undertake a volatility analysis of gold prices returns for the data series from the 1st of February
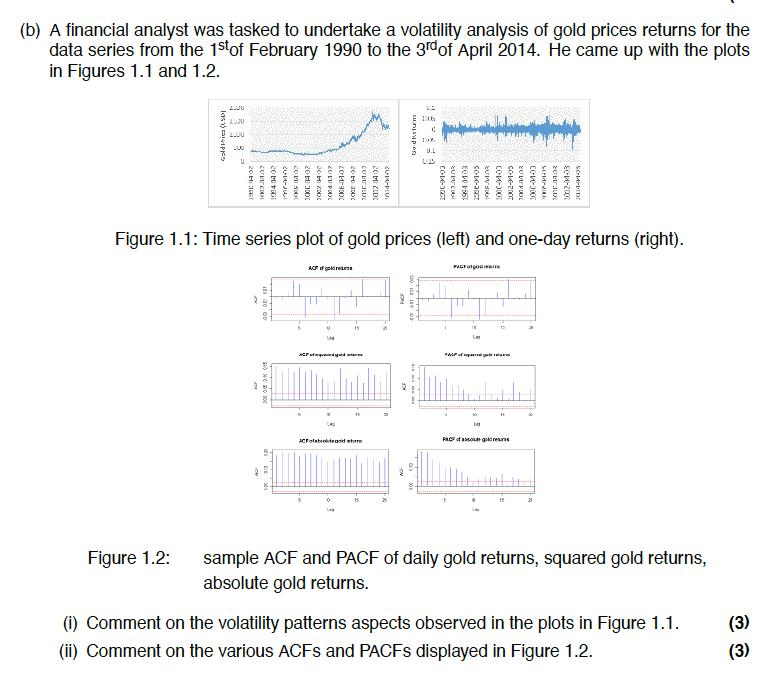
(b) A financial analyst was tasked to undertake a volatility analysis of gold prices returns for the data series from the 1st of February 1990 to the 3rd of April 2014. in Figures 1.1 and 1.2. He came up with the plots las) Figure 1.2: 2000 1500 2000 200 U 2010 J 110 100 20 MEGI SIO NO PO -- 1015 14:02 2001: 14:02 2000 2001 2000 POOL C zomrado 20 H 2000 comtraux 20 MI ZDI 20-DO-PLU ACF f gold res U LA ACFofabed 15 God Returns Figure 1.1: Time series plot of gold prices (left) and one-day returns (right). PROS issue E 106 LEATHE 0 U.L CO-MG-ORGT SUDUCI EQ PO POT PA 1388-04-05 PICT TW LA SUVUSIO cove-300 L FACF of a gre 2012-01-05 2004.04.02 15 CO-40-3000 SUPAPRIK 20vrau SCP-2007 SC-IDT sample ACF and PACF of daily gold returns, squared gold returns, absolute gold returns. (i) Comment on the volatility patterns aspects observed in the plots in Figure 1.1. (ii) Comment on the various ACFS and PACFS displayed in Figure 1.2. (3) (3)
Step by Step Solution
3.54 Rating (154 Votes )
There are 3 Steps involved in it
Comment on the volatility patterns aspects observed in the plots in Figure 11 From the time series p... View full answer

Get step-by-step solutions from verified subject matter experts