

Question: (b) A pulse test identification experiment performed on a process gave rise to the Bode diagram shown below in Figure P9.1. Postulate a possible
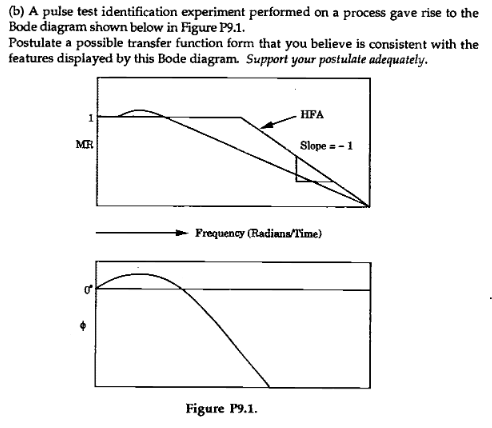
(b) A pulse test identification experiment performed on a process gave rise to the Bode diagram shown below in Figure P9.1. Postulate a possible transfer function form that you believe is consistent with the features displayed by this Bode diagram. Support your postulate adequately. 1 MR HFA Slope = -1 Frequency (Radiana/Time) Figure P9.1.
Step by Step Solution
There are 3 Steps involved in it
1 Expert Approved Answer
Step: 1 Unlock

To determine a possible transfer function based on the given Bode diagram we observe the following 1 ... View full answer
Question Has Been Solved by an Expert!
Get step-by-step solutions from verified subject matter experts
Step: 2 Unlock
Step: 3 Unlock