

Question: b. Assuming a linear relationship, use the least-squares method to determine the regression coefficients b0 = b1 = c. Interpret the meaning of the slope,
b. Assuming a linear relationship, use the least-squares method to determine the regression coefficients
b0 =
b1 =
c. Interpret the meaning of the slope, b1,in this problem. Select the correct choice below and fill in the answer box to complete your choice.
A.For each increase in starting salary upon graduation of $100, the mean tuition is expected to increase by $___?
B.The approximate tuition when the mean starting salary is $0 is $___.
C.For each increase in tuition of $100, the mean starting salary upon graduation is expected to increase by $____.
D.The approximate starting salary upon graduation when the tuition is $0 is $___.
d. Predict the mean starting salary upon graduation for a program that has a per-year tuition cost of$44,726.
The predicted mean starting salary will be $___?
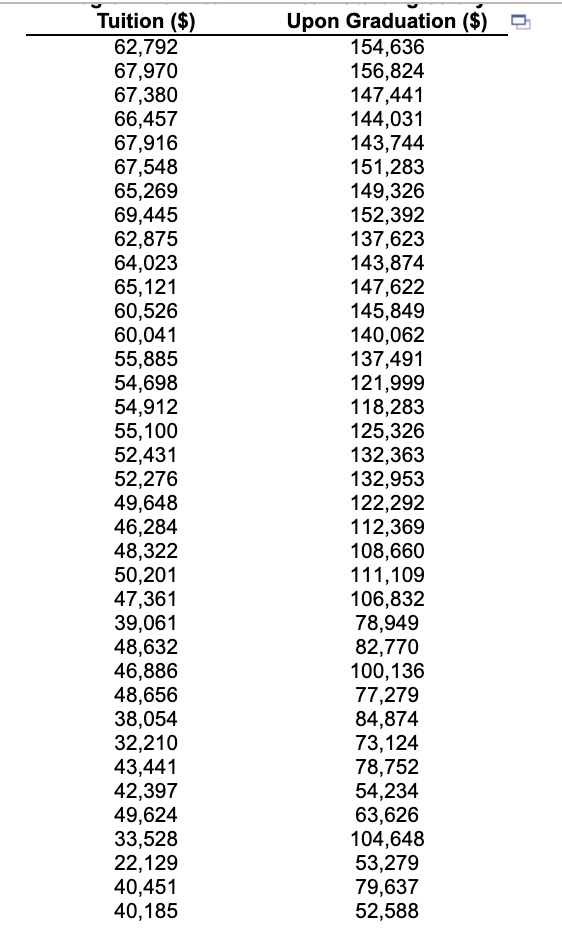
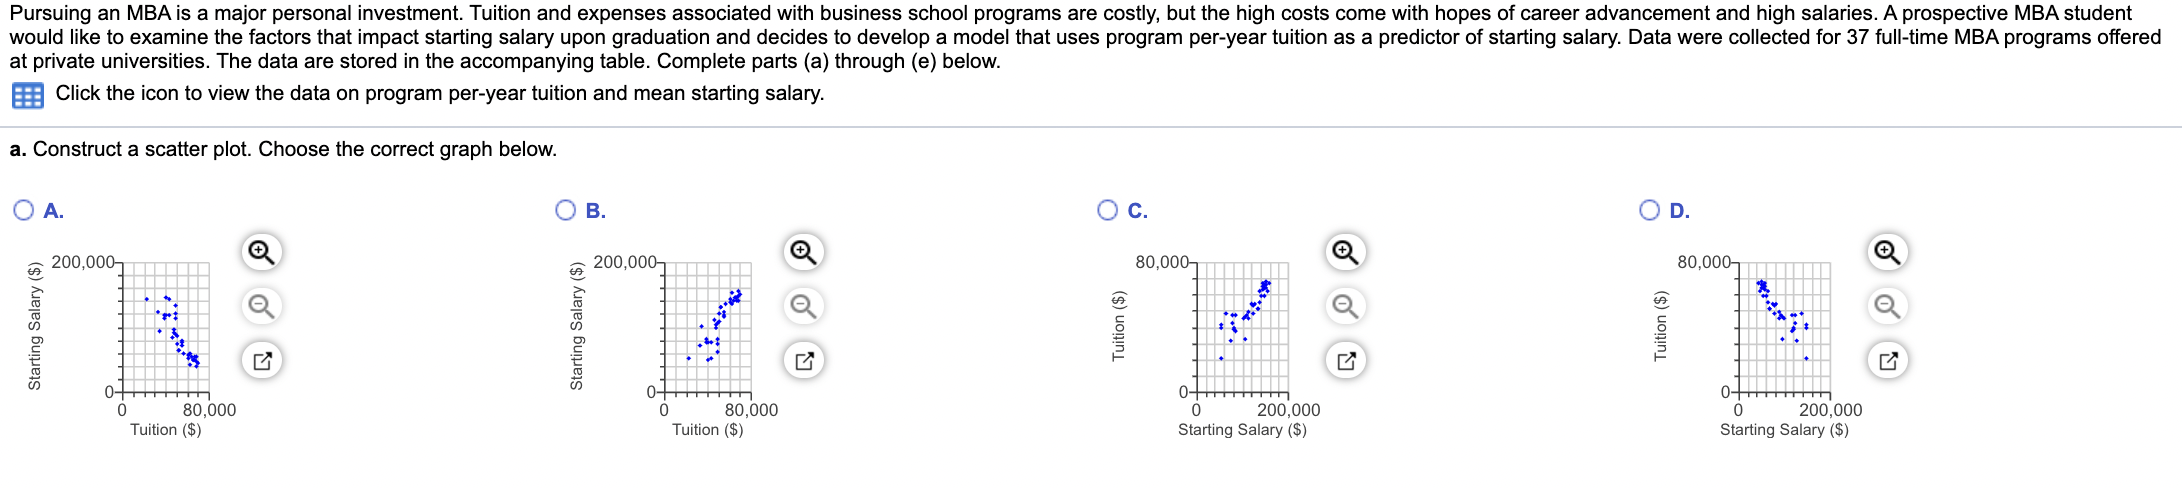
n Tuition ($) 62,792 67,970 67,380 66,457 67,916 67,548 65,269 69,445 62,875 64,023 65,121 60,526 60,041 55,885 54,698 54,912 55,100 52,431 52,276 49,648 46,284 48,322 50,201 47,361 39,061 48,632 46,886 48,656 38,054 32,210 43,441 42,397 49,624 33,528 22,129 40,451 40,185 Upon Graduation ($) 154,636 156,824 147,441 144,031 143,744 151,283 149,326 152,392 137,623 143,874 147,622 145,849 140,062 137,491 121,999 118,283 125,326 132,363 132,953 122,292 112,369 108,660 111,109 106,832 78,949 82,770 100,136 77,279 84,874 73,124 78,752 54,234 63,626 104,648 53,279 79,637 52,588 Pursuing an MBA is a major personal investment. Tuition and expenses associated with business school programs are costly, but the high costs come with hopes of career advancement and high salaries. A prospective MBA student would like to examine the factors that impact starting salary upon graduation and decides to develop a model that uses program per-year tuition as a predictor of starting salary. Data were collected for 37 full-time MBA programs offered at private universities. The data are stored in the accompanying table. Complete parts (a) through (e) below. Click the icon to view the data on program per-year tuition and mean starting salary. a. Construct a scatter plot. Choose the correct graph below. A. B. C. OD. 200,000 200,000 80,000 80,000 *** Tuition ($) .: 0- 0 80,000 Tuition ($) 0+ 0 80,000 Tuition ($) 0- 0 200,000 Starting Salary ($) 0+ 0 200,000 Starting Salary ($)
Step by Step Solution
There are 3 Steps involved in it

Get step-by-step solutions from verified subject matter experts