

Question: b) Based on the theories outlined in your study on International Parity Conditions, briefly outline (in no more than 300 words) which theory/s do you
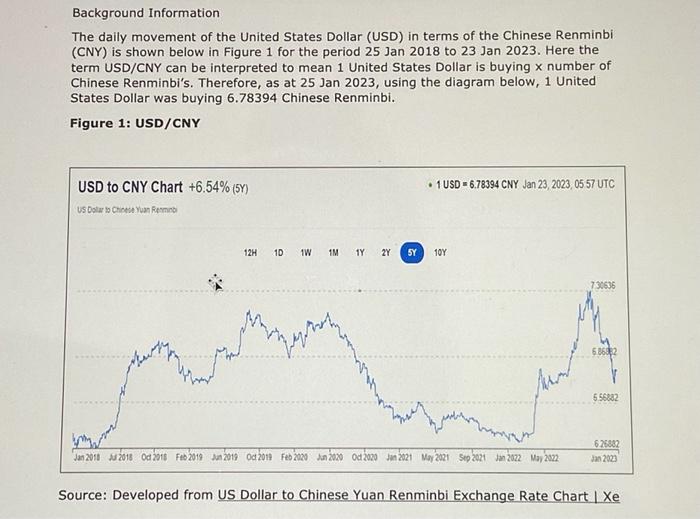
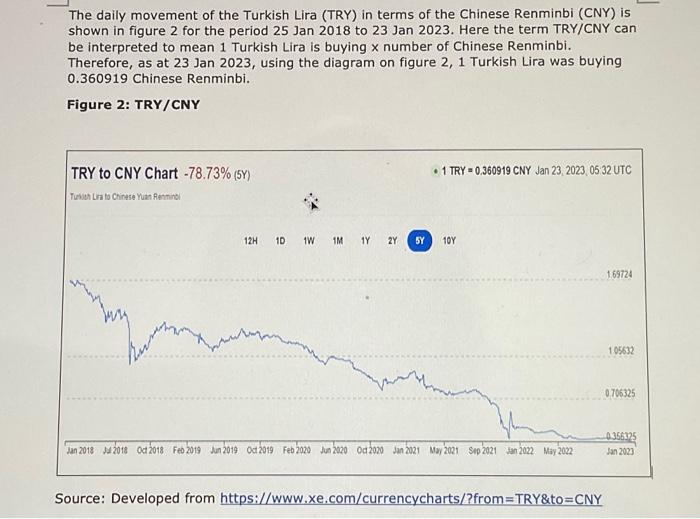
Background Information The daily movement of the United States Dollar (USD) in terms of the Chinese Renminbi (CNY) is shown below in Figure 1 for the period 25 Jan 2018 to 23 Jan 2023. Here the term USD/CNY can be interpreted to mean 1 United States Dollar is buying x number of Chinese Renminbi's. Therefore, as at 25 Jan 2023, using the diagram below, 1 United States Dollar was buying 6.78394 Chinese Renminbi. Figure 1: USD/CNY Source: Developed from US Dollar to Chinese Yuan Renminbi Exchange Rate Chart | Xe The daily movement of the Turkish Lira (TRY) in terms of the Chinese Renminbi (CNY) is shown in figure 2 for the period 25 Jan 2018 to 23 Jan 2023. Here the term TRY/CNY can be interpreted to mean 1 Turkish Lira is buying number of Chinese Renminbi. Therefore, as at 23 Jan 2023, using the diagram on figure 2, 1 Turkish Lira was buying 0.360919 Chinese Renminbi. Figure 2: TRY/CNY Source: Developed from https://www.xe.com/currencycharts/?from=TRY\&to=CNY
Step by Step Solution
There are 3 Steps involved in it

Get step-by-step solutions from verified subject matter experts