

Question: b, c, and d The average weekly sales for a c othing store between 2004 and 2008 are given below. Average Weekly Sales for a
b, c, and d
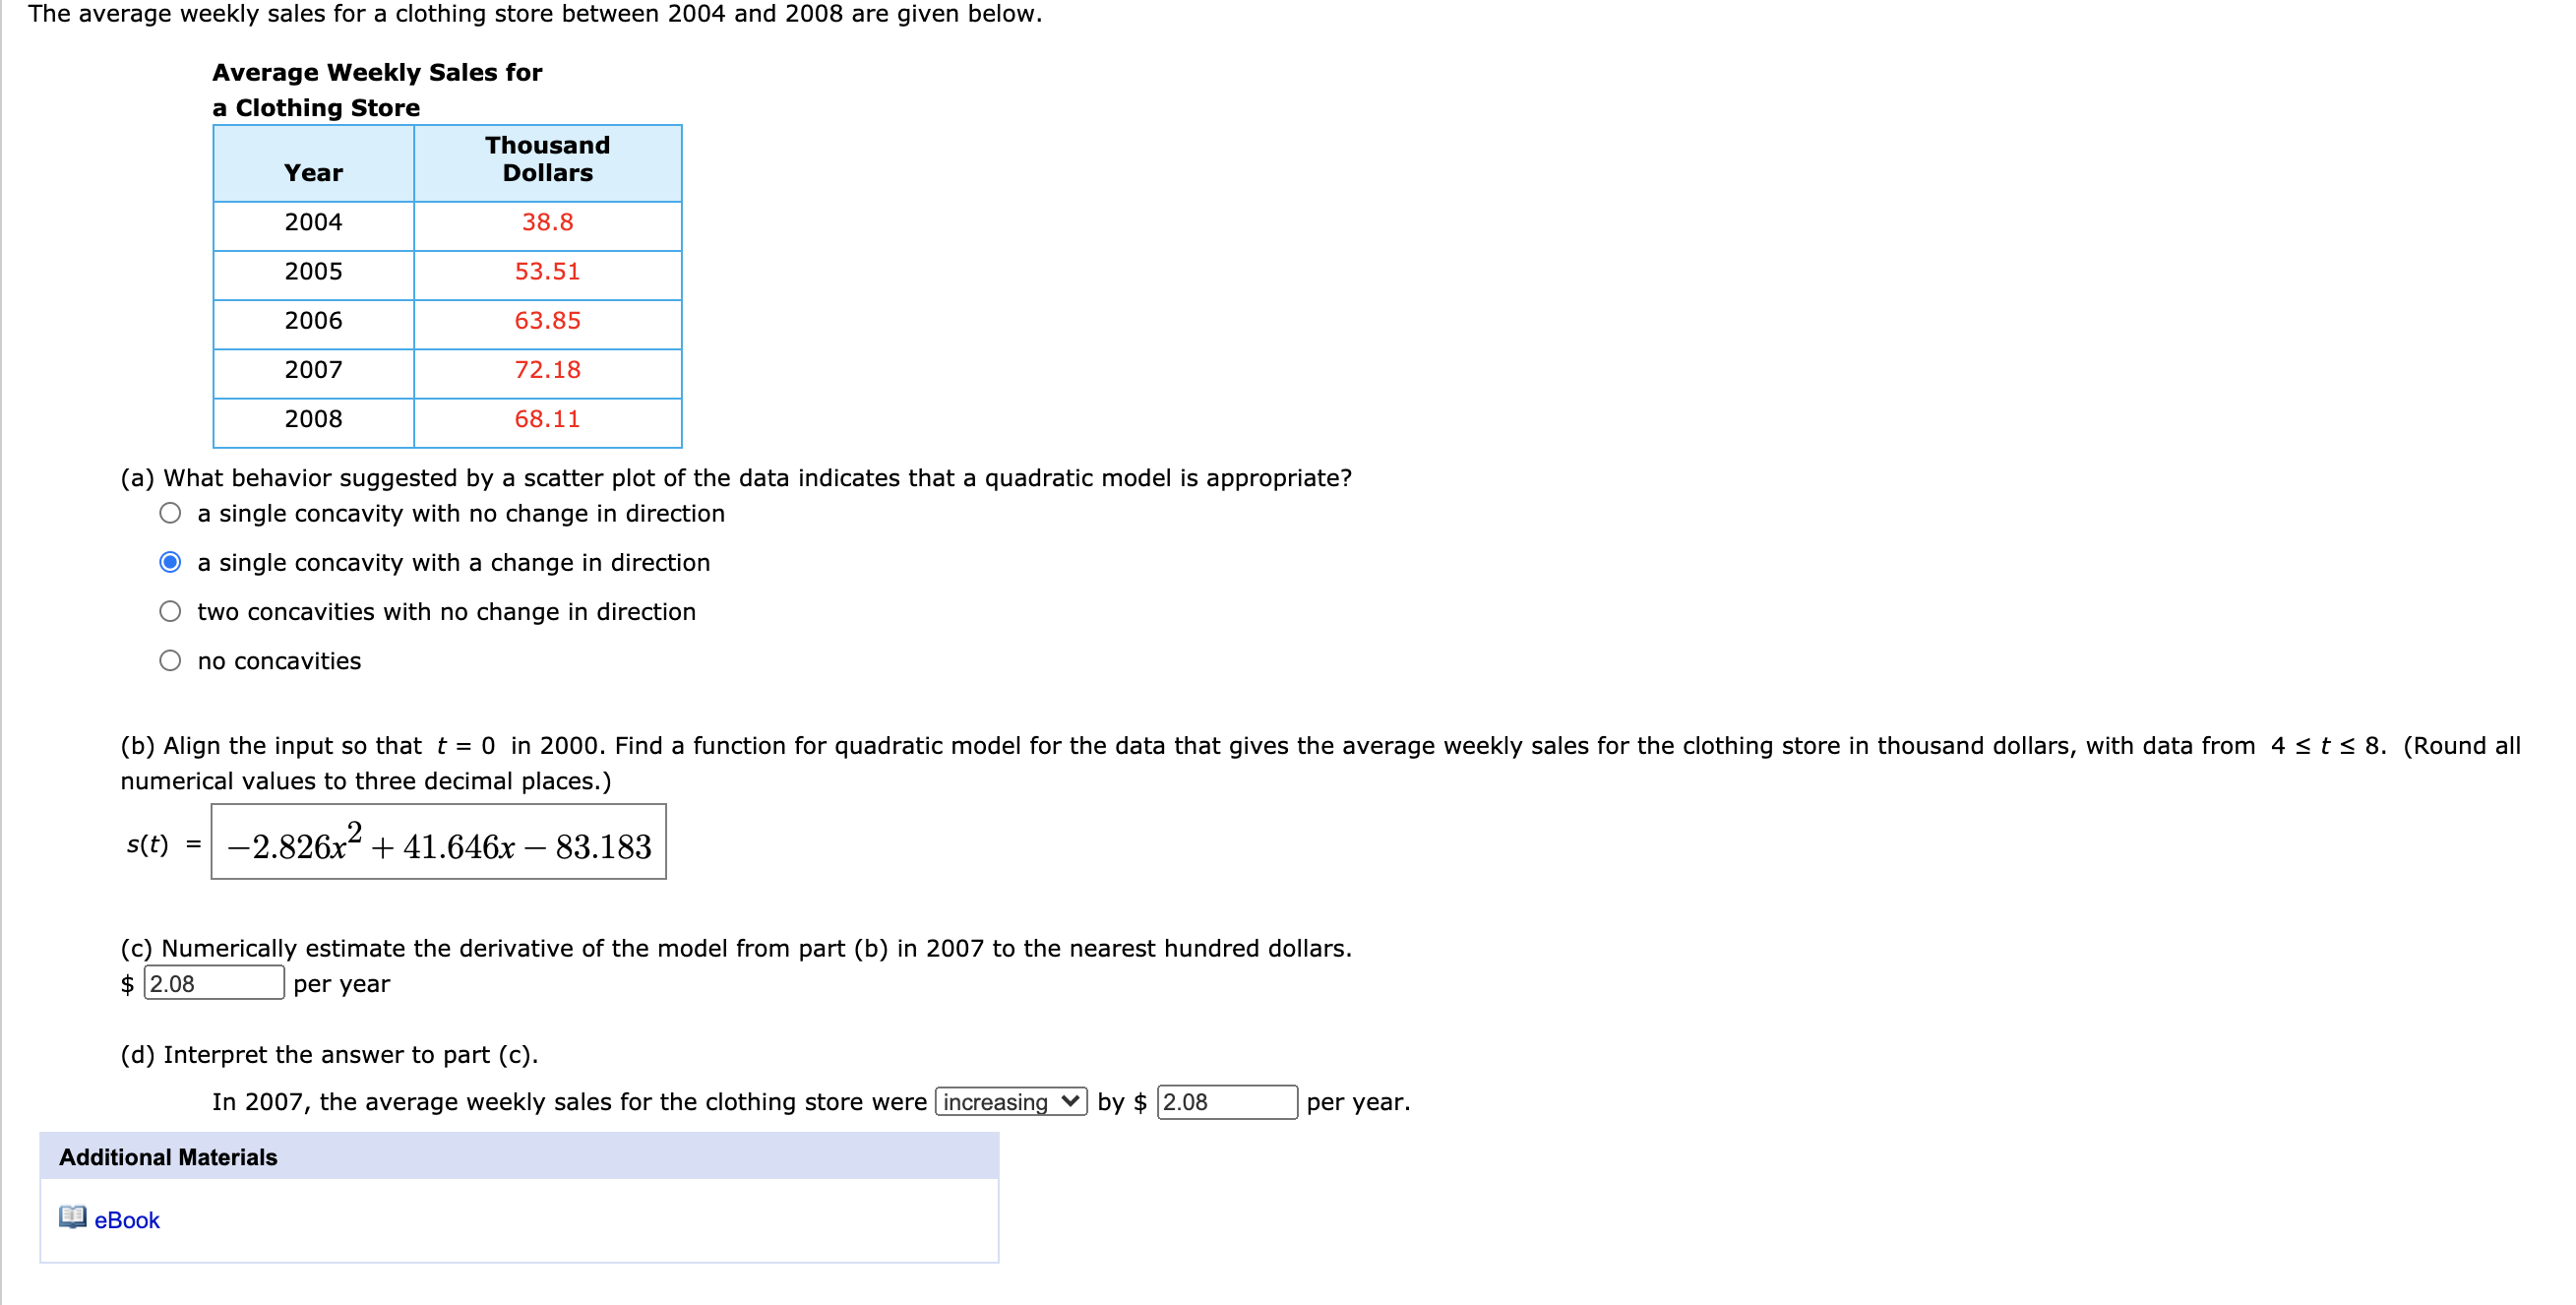
The average weekly sales for a c othing store between 2004 and 2008 are given below. Average Weekly Sales for a Clothing Store Thousand Year Dollars 2004 38.8 2005 53.51 2006 63.85 2007 72.18 2008 68.11 (a) What behavior suggested by a scatter plot of the data indicates that a quadratic model is appropriate? 0 a single concavity with no change in direction 3 single concavity with a change in direction 0 two concavities with no change in direction 0 no concavities (b) Align the input so that t = 0 in 2000. Find a function for quadratic model for the data that gives the average weekly sales for the clothing store in thousand dollars, with data from 4 S t S 8. (Round all numerical values to three decimal places.) sm = 2.826x2 + 41.646): 83.183 (c) Numerically estimate the derivative of the model from part (b) in 2007 to the nearest hundred dollars. $ 2.08 per year (d) Interpret the answer to part (c). In 2007, the average weekly sales for the clothing store were increasing V by $ 2.08 per year. Additional Materials III eBook
Step by Step Solution
There are 3 Steps involved in it

Get step-by-step solutions from verified subject matter experts